Tag Archives: Venture Capital

Data about equity of 600 startups – comments (1)

As a follow-up to my recent post on (updated) data on 600 (former) startups, here is a first post about (what I think) are interesting or intriguing results.

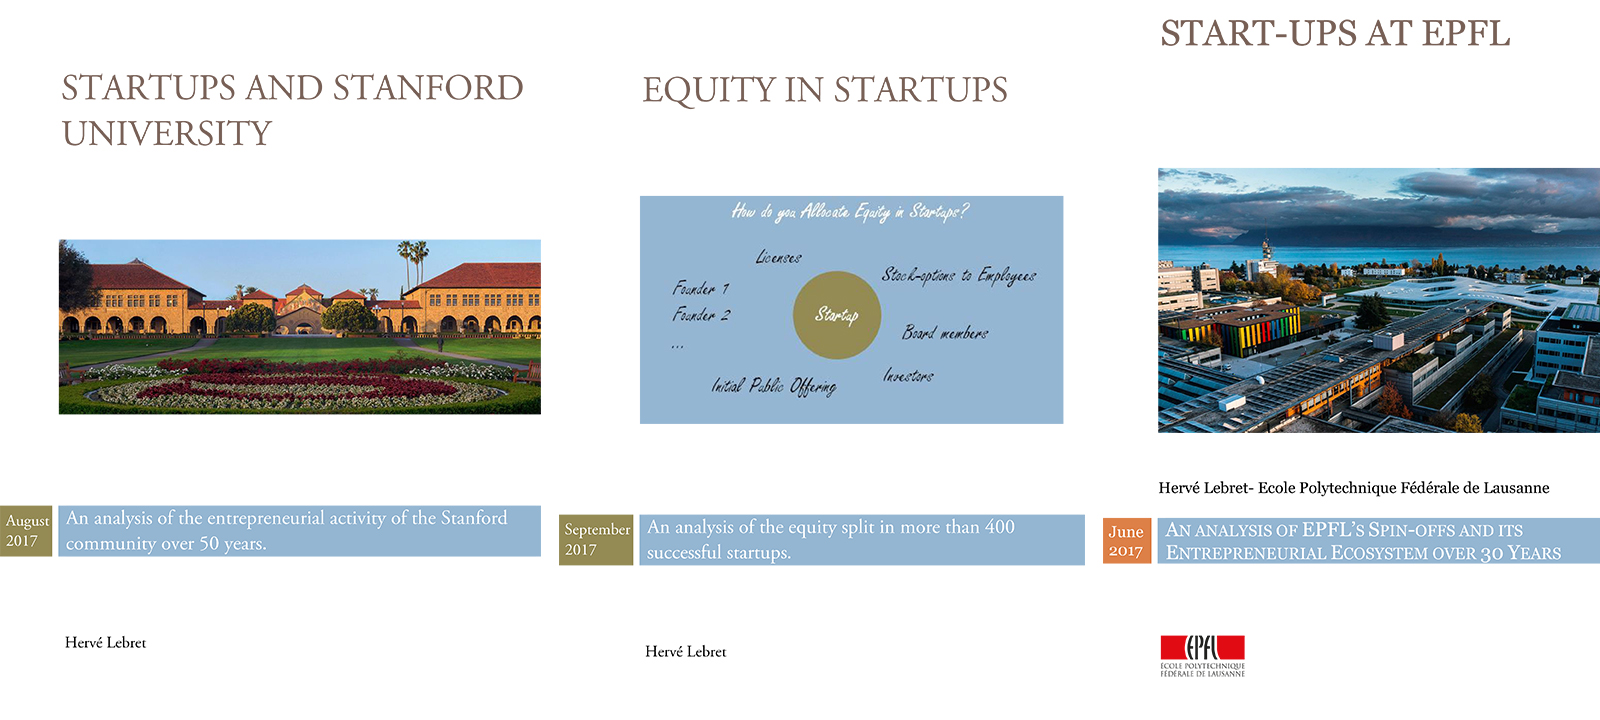
Without doing too much self-promotion, let me add that I have in the past already dealt with the topic as I mentionin the document or through the following illustration:
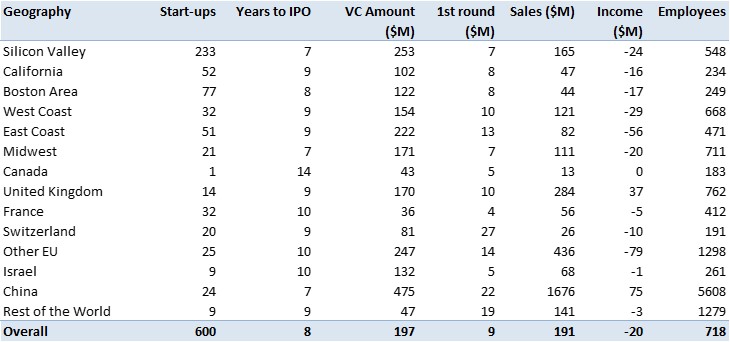
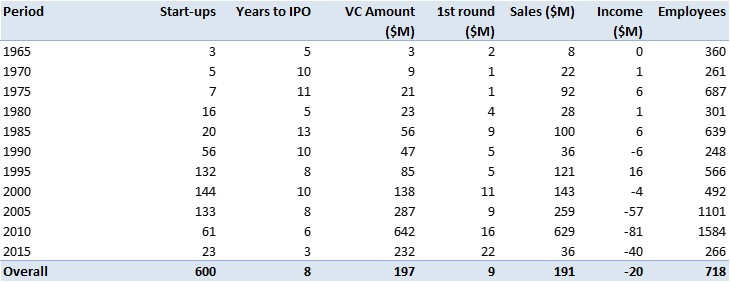
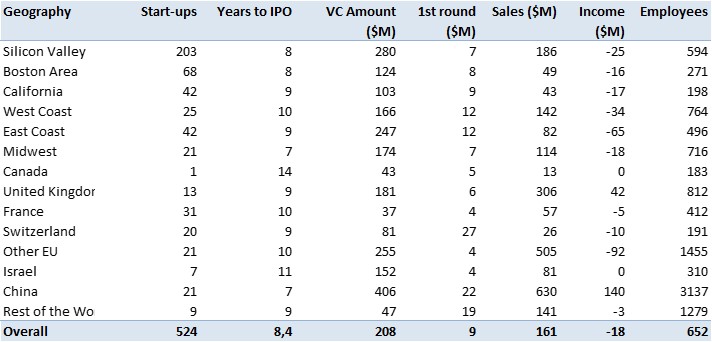
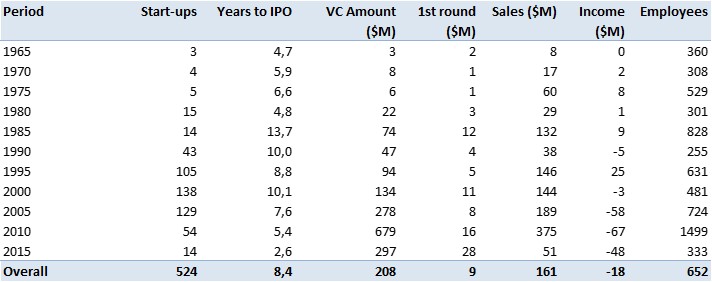
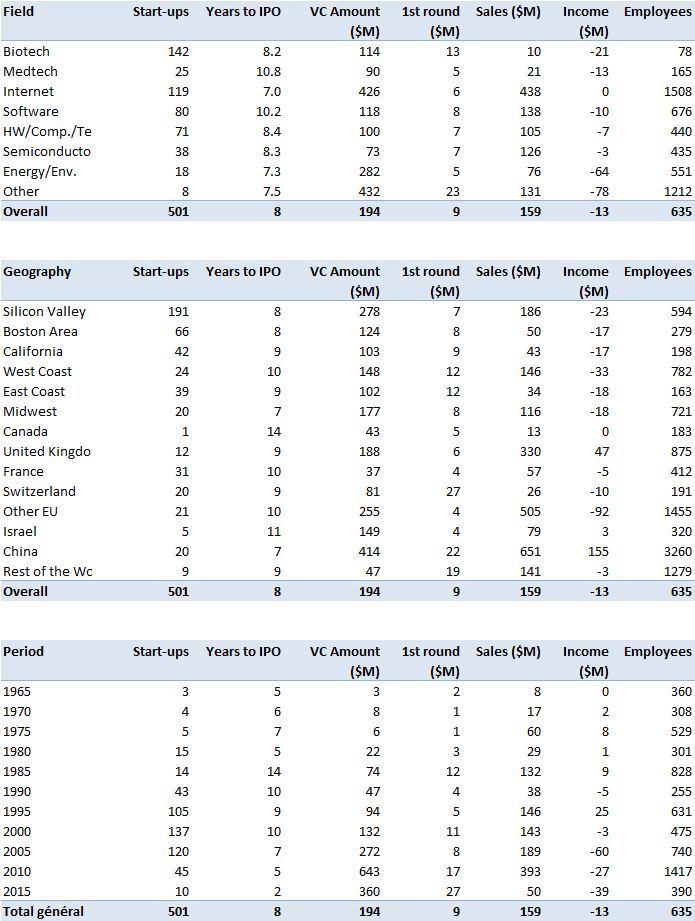
My first comment is that the differences linked to fields or geographies are not that big, whereas data evolved more over time (fifty years). Amounts of venture capital, years to IPO, sales, profits, employees are not that different for example except in biotech maybe, for sales and employees at least.

One important note: in my list of 600 companies, only 15 did not have venture capital (or at least private investors). Is there a bias here? I am not sure, but I could be wrong.

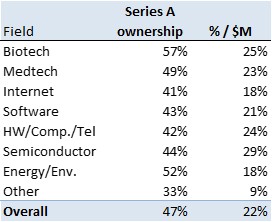
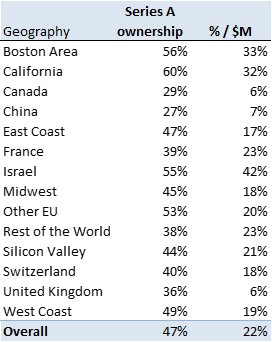
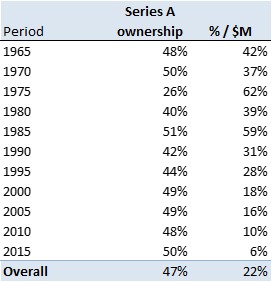
These “comment” posts will be short and I finish this one with a look at Series A, the 1st investment round. The amounts are substantial, $8M on average. I did a new analysis, i.e. to find out how much VCs take at this stage and on average, it’s … 47%. A little less in IT, a little more in healthcare, a little less in Silicon Valley, a little more in Boston.

If I bring it back to the percentage per million, that gives 22%, I let you think about this astonishing result … but we must also look at the median values, because all this is not gaussian as I have often say, but follows a power law. Median values are $4.5M for Series A in exchange for 45.5% and 10% for $M.

Updated data in equity of 600 (former) startups

The Covid19 virus has an indirect effect, we have more time at home and in front of computers. So I updated my data in startup equity from 600 companies for which information was available, mostly because they had filed to go public. Here is the full list of individual data.
If you cannot visualize the document on scribd, here is a direct link to the pdf entitled Equity_in_600_Startups-Lebret-April2020.

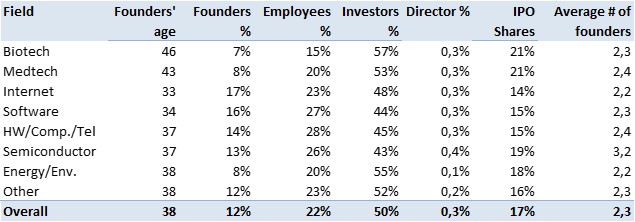
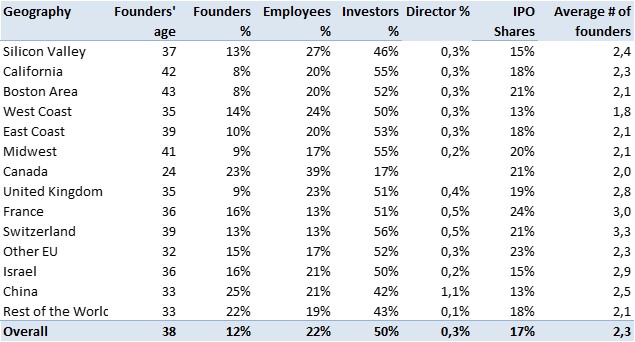
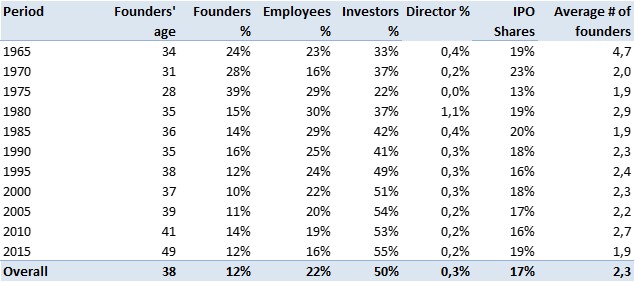
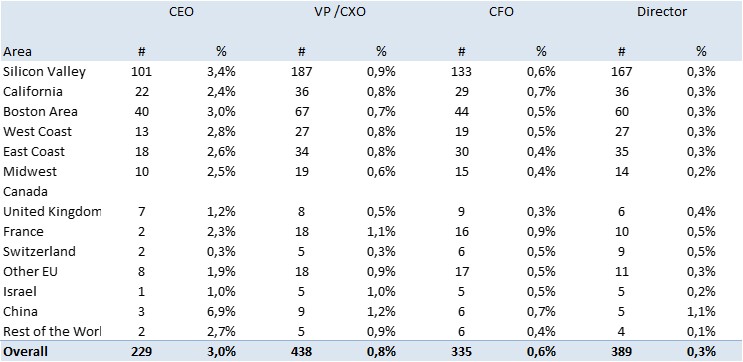
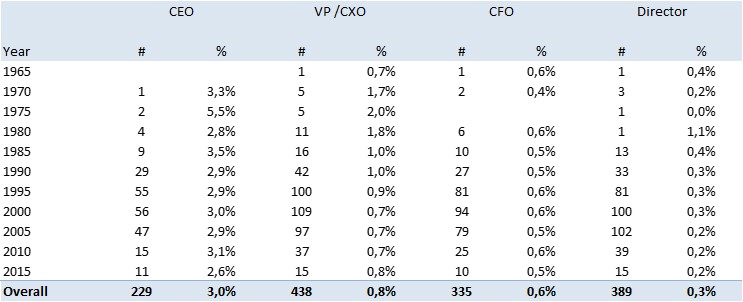
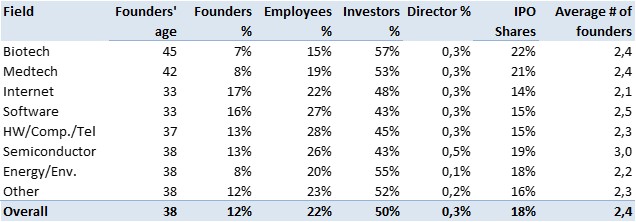
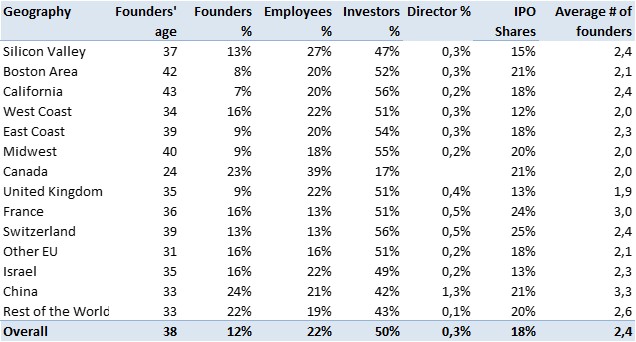
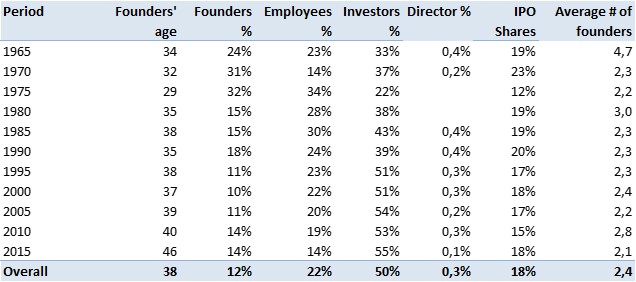
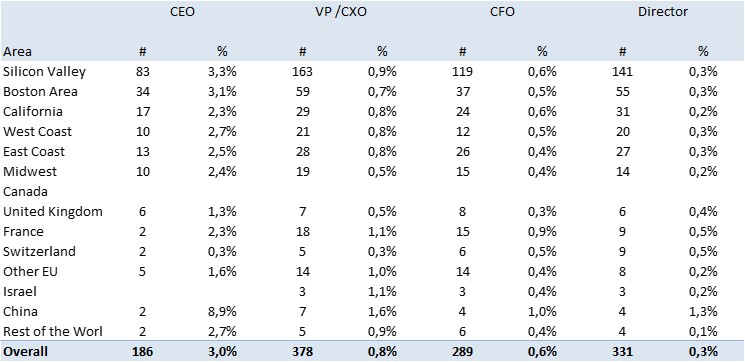
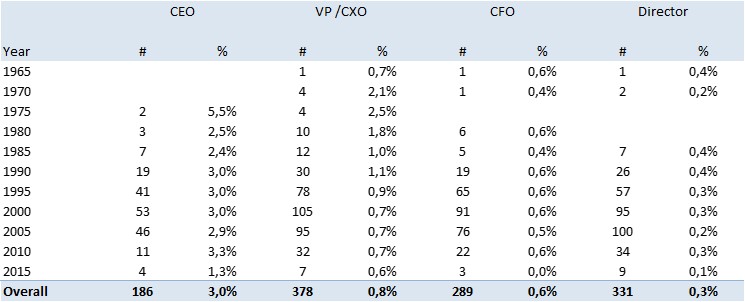
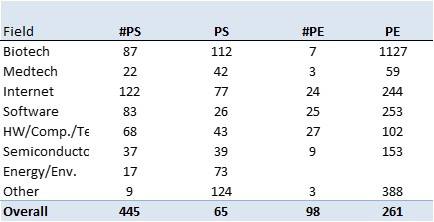
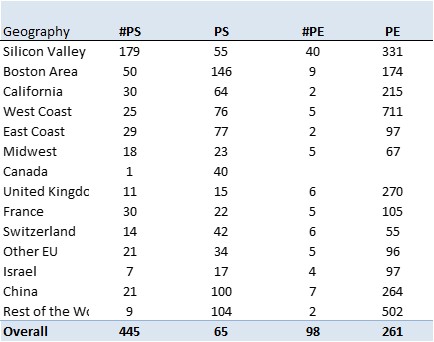
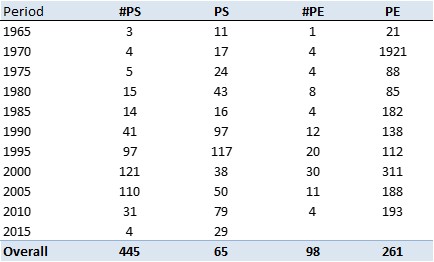
At the end of this 600+-page document, you’ll find some statistics, here they are again. I will probably come back to some results I find interesting not to say intriguing. Enjoy an react!

Some addtional comments in later posts:
1- About venture capital: on April 7 comments 1.
2- About the age of founders: on April 8 comments 2.
3- About the equity of founders: on April 9 comments 3.
4- How is equity shared: on April 10, comments 4.
5- About the equity of non-founding CEOS: on April 11, comments 5.
6- About valuation of startups: on April 12, comments 6.
7- What have they become: on April 16, comments 7.

Basic data about startups (funding, sales, profits, employees at IPO and years to IPO) by fields, geographies and periods of time.

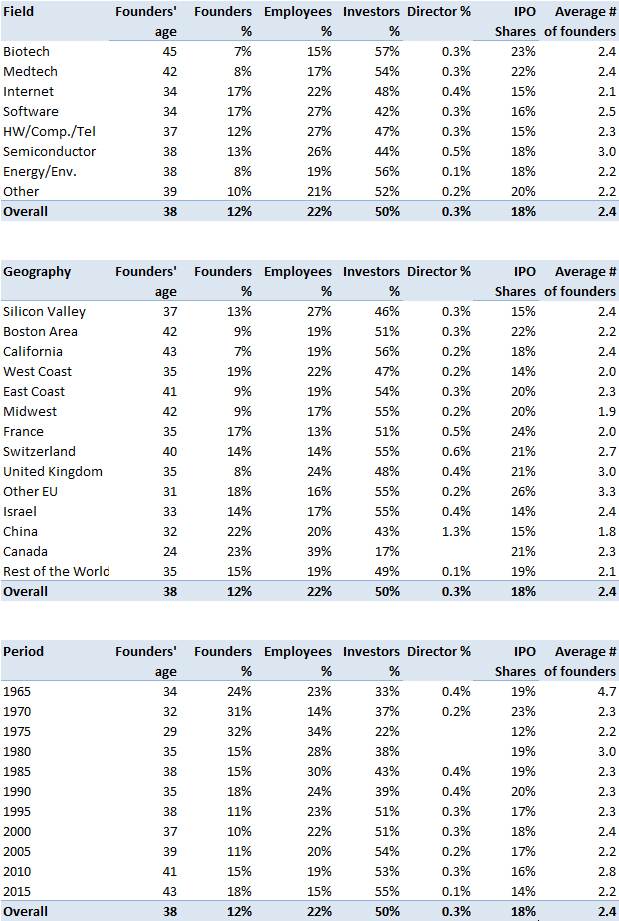
Data about founders (age, ownership and nb. by startups) and other stakeholders by fields, geographies and periods of time.

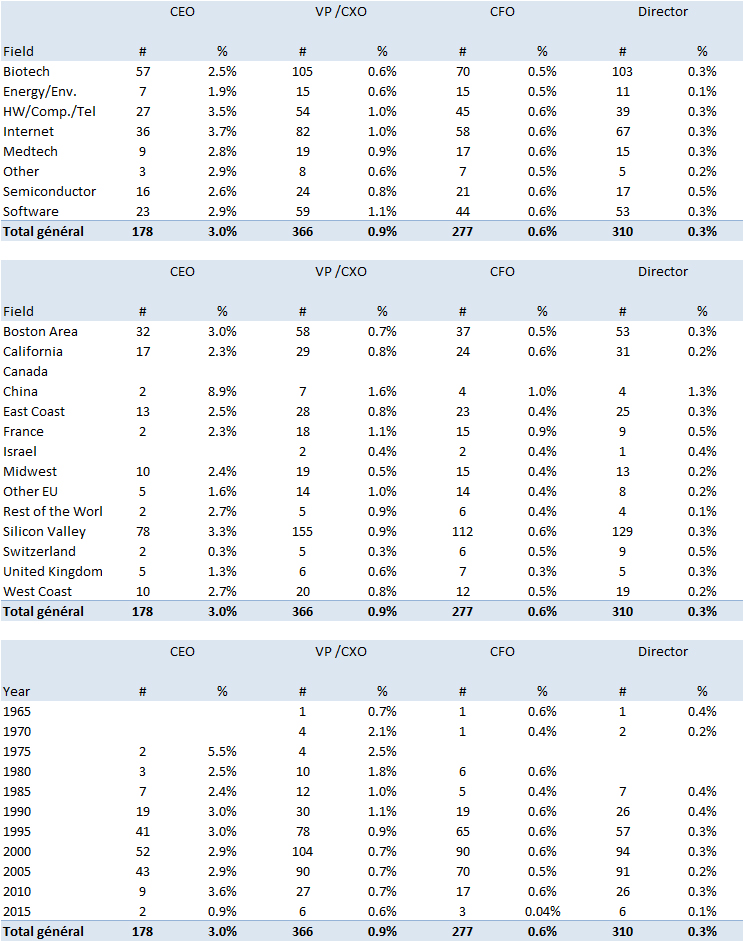
Data about ownership of non-founding CEOs, VPs, CXOs, board members by fields, geographies and periods of time.

New data about ownership of series A investors by fields, geographies and periods of time.

Venture Capital, Nasdaq and Crises

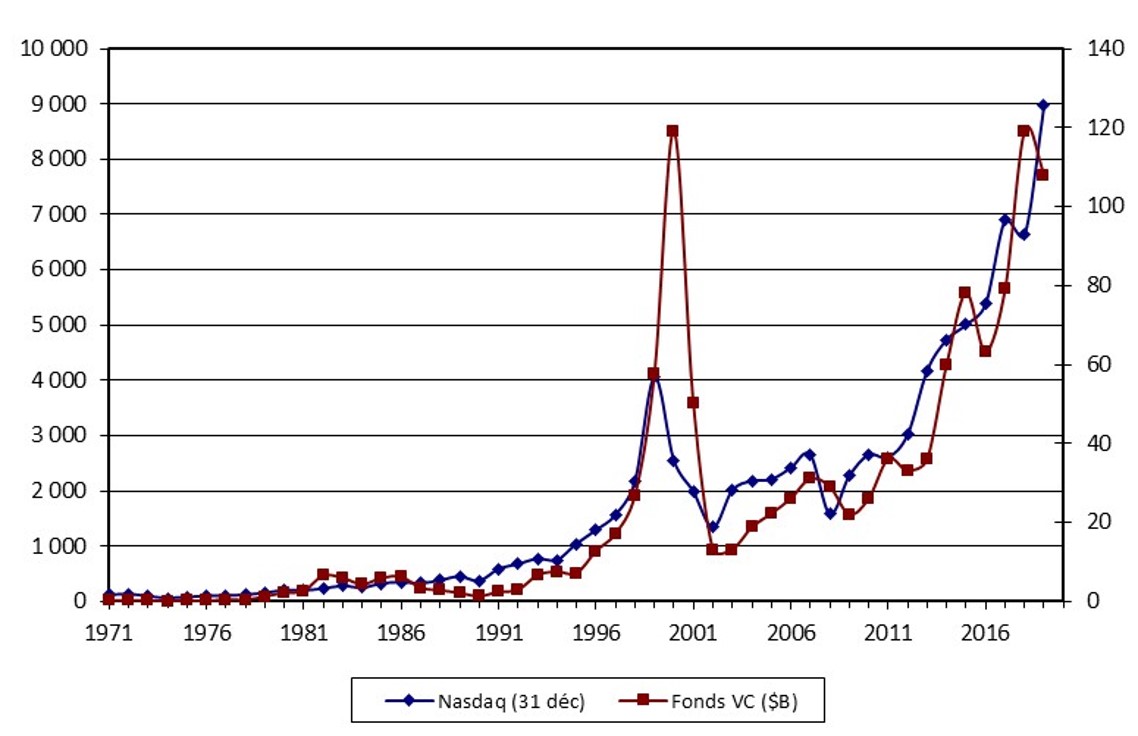
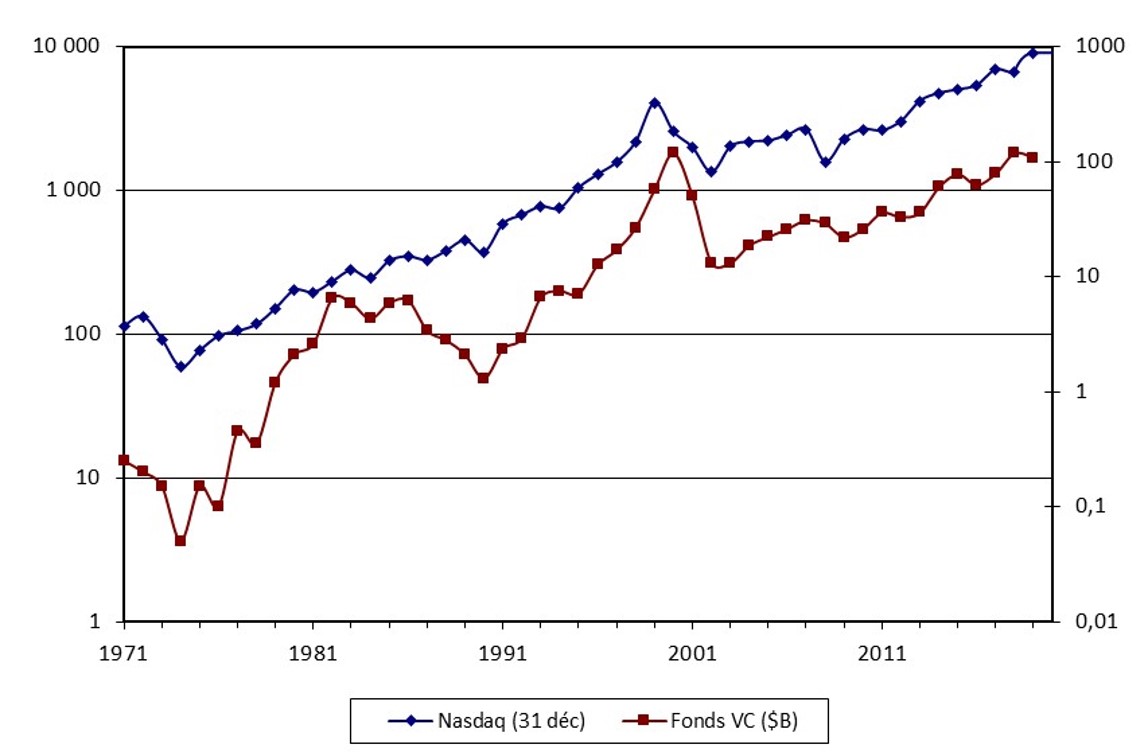
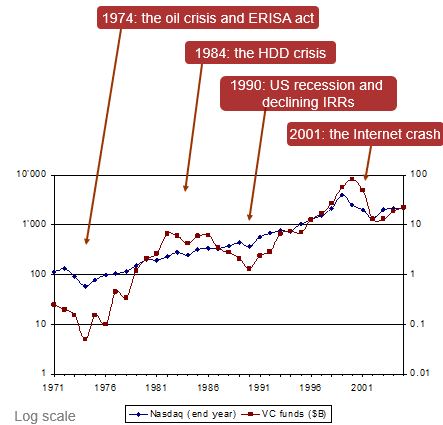
When I published the book which is the “raison d’être” of this blog, I had shortly analyzed the correlations between venture capital level in the USA, the Nasdaq index and their relationship to “crises”. Each peak and bottom level could be easily explained. I updated it to today levels with idea of revisiting when we zill be out of the Covid19 crisis. Comments welcome!

Bubbles, bubbles, they have always been around! Here is Casper…

Speculation, bubbles, yes, they have always been around. I entered the VC world in the late 90s. Now we are in the unicorns era. Or were we?

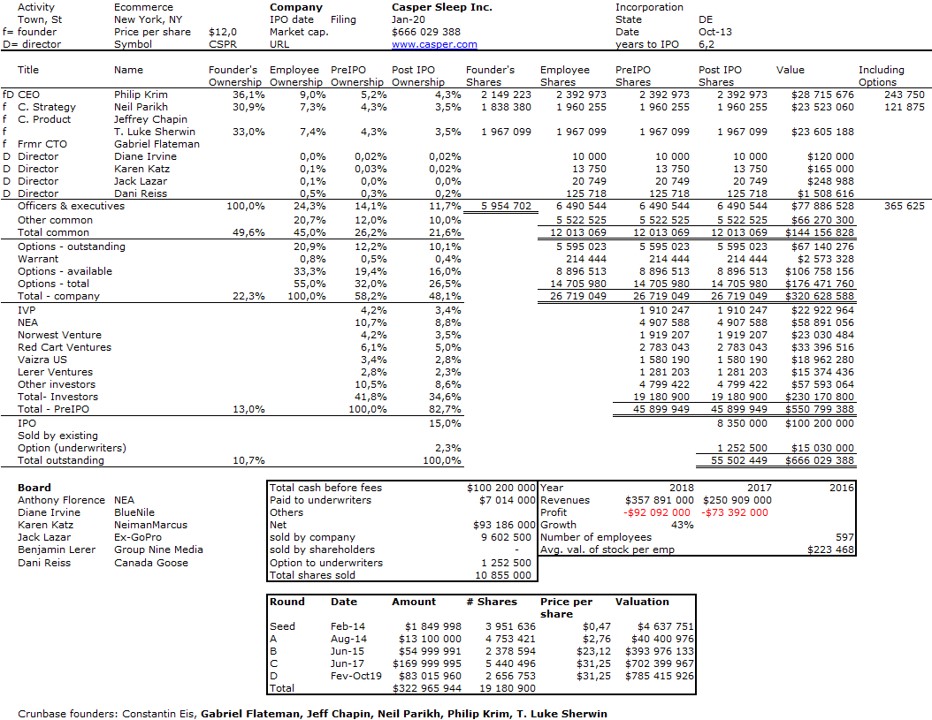
I did my 537th startup cap. table a few days ago (see below). I had hesitated a little as I was not sure a company selling mattresses, even online, could be classified in my list of tech companies. But with VCs like NEA, IVP, Norwest on board and leading banks such as Goldman Sachs and Morgan Stanley as underwriters, it had all the needed pedigree. Or at least it looked like it.

Then I read Casper’s IPO is officially a disaster on CNN and Here’s why Casper’s disappointing IPO could spell disaster for other unicorns on Business Insider Nordic

What happened? Well the initial IPO price on the table below should have been $18, then it was fixed at $12 for the first day of trading and this morning CSPR is at $10.26. The unicorn is now a $400M company. And you may want to have a look at the price of the B, C and D preferred rounds on the table below. Yes disasters happen from time to time.

As a quick remined my latest list to be updated when I will have reached 550 tables.

More data about equity in about 525 start-ups

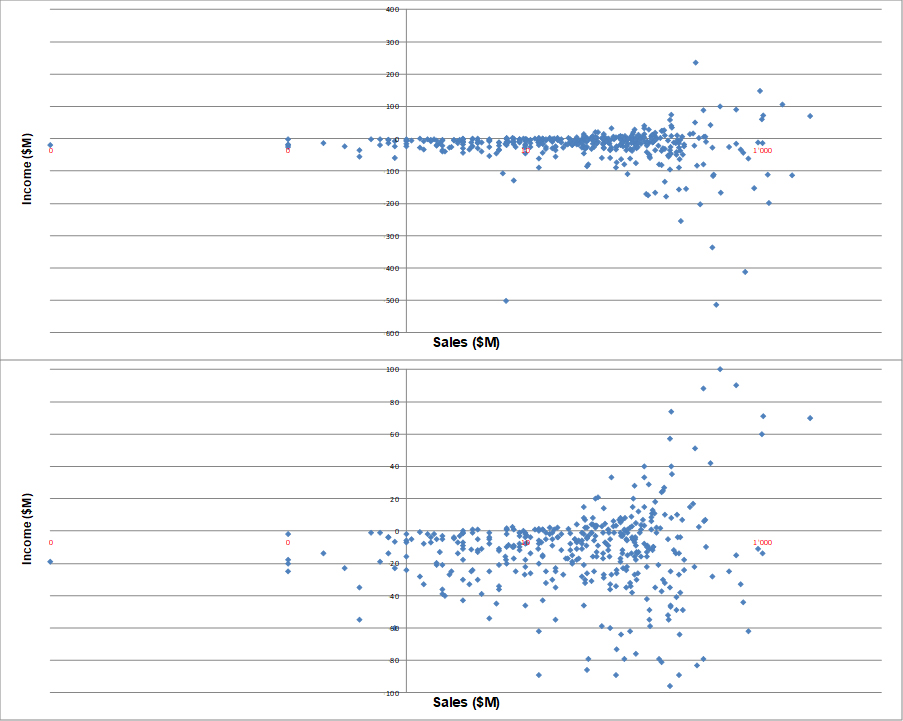
Here is an updated version of my equity tables from startups which filed to go public at some point. There are about 525 individual companies as well as just below statistical synthesis relatively to fields, geography and periods of time about VC amounts, time to IPO, levels of sales and income at IPO (as well as PS and PE ratios), age of founders, number of founders, ownership in companies by catagories. I think ths may be of interest for some of you…

The analysis of 500+ startups

Following my traditional analysis of startups through their IPO filings documents (you can check my 2017 analysis on 400+ documents here or the tag #equity on this blog), here is an updated analysis with 500+ start-ups.

You can have a look at the full 500 cap. tables on scribd or look at a shorter synthesis which follows.I hope this is self-explanatory enough.

Fascinating data analyses on start-ups by Sebastian Quintero

I just read about Sebastian Quintero’s data analyses on start-ups on his web site Towards Data Science. Thanks Martin H. 🙂 I was really fascinated about his original way of looking at them, their failure rate, the valuation prediction, their runway between rounds, and his Capital Concentration Index or Investor Cluster Score. You should read them.

Of course, it rang strong bells with all the data analyses I have done in the recent past 8see end of the post if you wish)

So as an appetizer to Quintero‘s work, here are a couple of figures taken from his site…

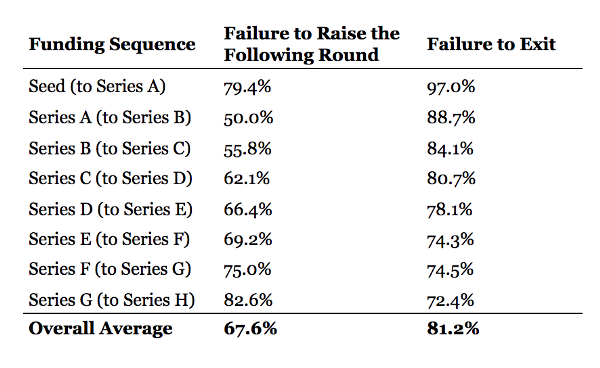
Dissecting startup failure rates by stage

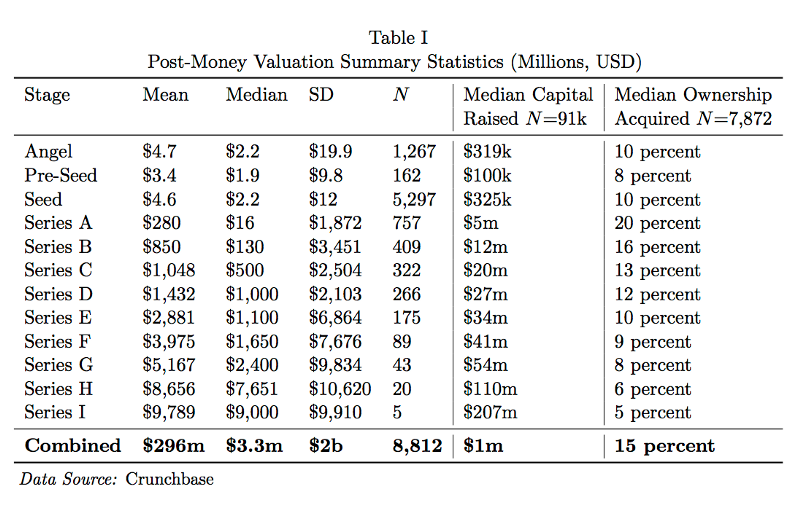
Predicting a Startup Valuation with Data Science

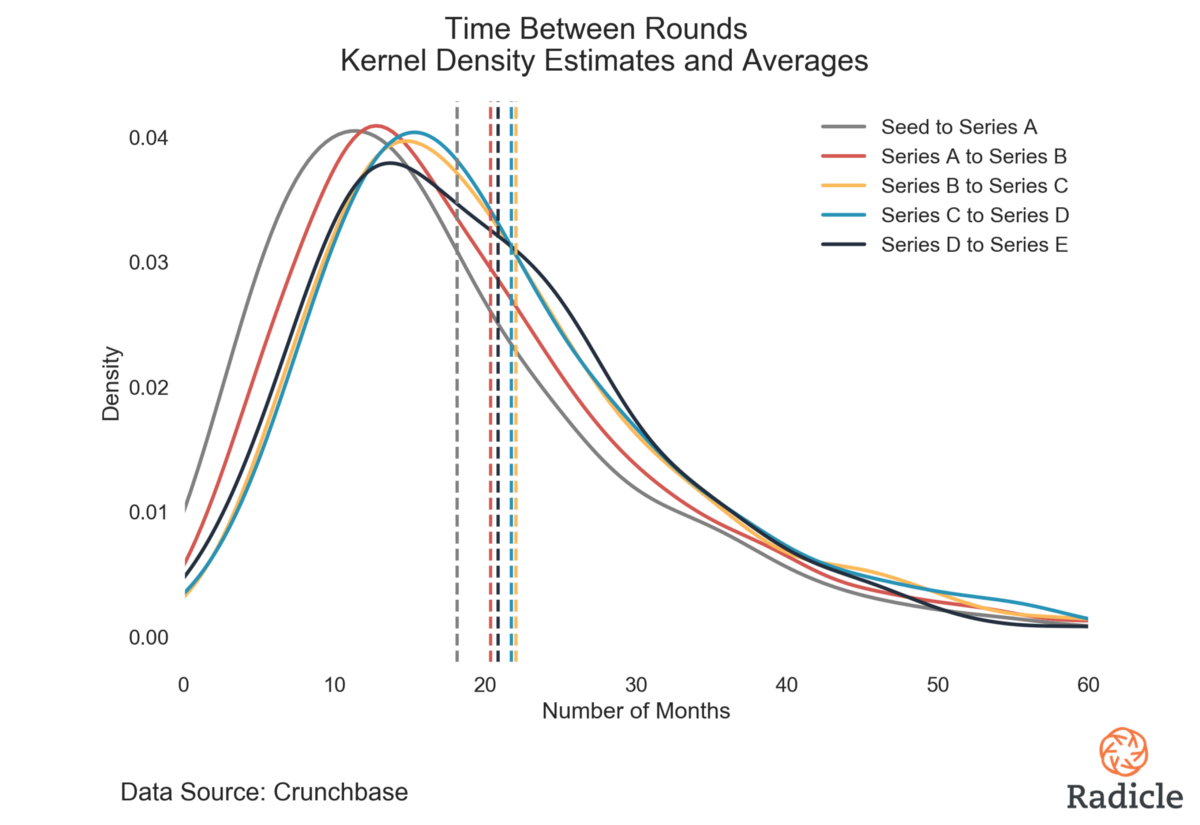
How much runway should you target between financing rounds?

Introducing the Capital Concentration Index™

Where c is the percentage capital share held by the i-th startup, and N is the total number of startups in the defined set. In general, the CCI approaches zero when a sector consists of a large number of startups with relatively equal levels of capital, and reaches a maximum of 10,000 when a sector’s total invested capital is consolidated in a single company. The CCI increases both as the number of startups in the sector decreases and as the disparity in capital traction between those startups increases.

Introducing the Investor Cluster Score™ — a measure of the signal produced by a startup’s capitalization table

As of my own analysis, here are a couple of links…

My papers on arxiv:
– Are Biotechnology Startups Different? https://arxiv.org/abs/1805.12108
– Equity in Startups https://arxiv.org/abs/1711.00661
– Startups and Stanford University https://arxiv.org/abs/1711.00644

or on SSRN
– Age and Experience of High-tech Entrepreneurs http://dx.doi.org/10.2139/ssrn.2416888
– Serial Entrepreneurs: Are They Better? – A View from Stanford University Alumni http://dx.doi.org/10.2139/ssrn.2416888
– Start-Ups at EPFL. An Analysis of EPFL’s Spin-Offs and Its Entrepreneurial Ecosystems Over 30 Years https://papers.ssrn.com/sol3/papers.cfm?abstract_id=3317131

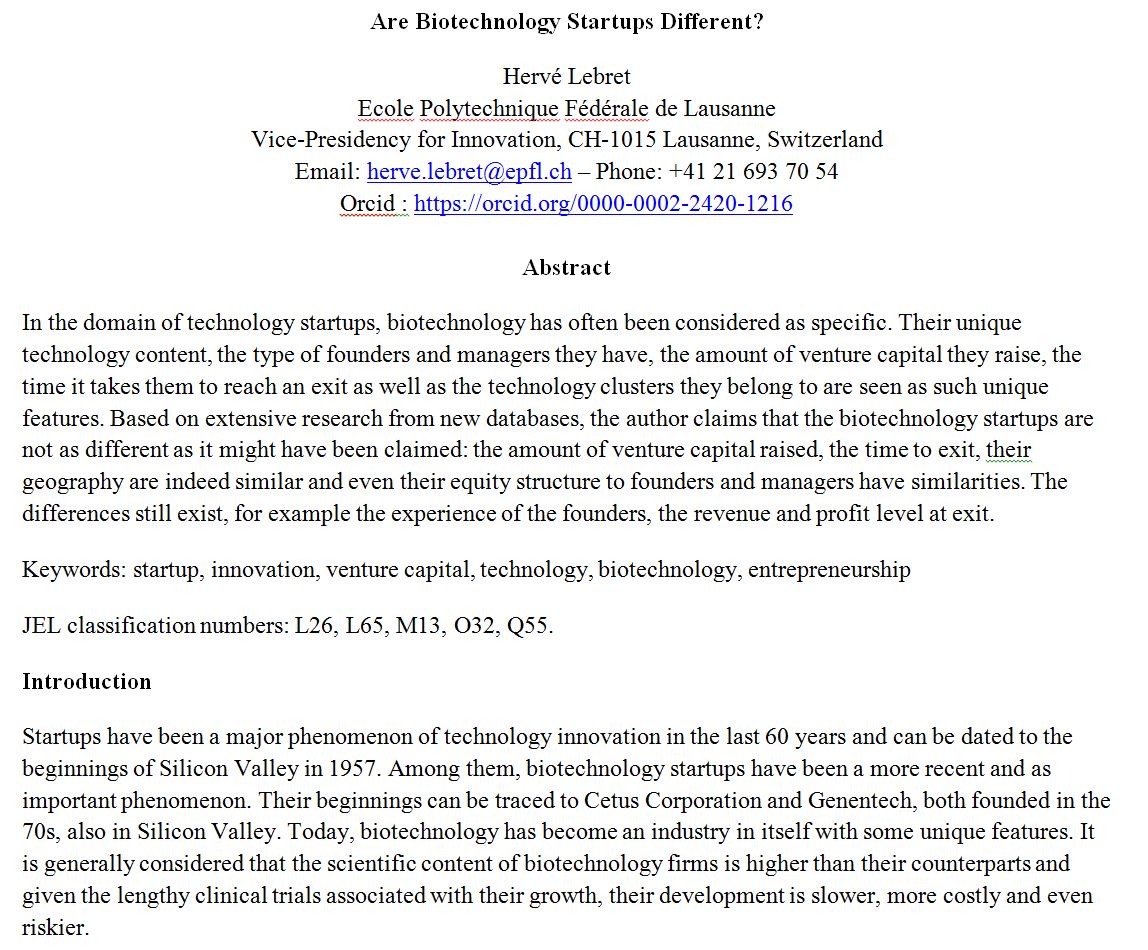
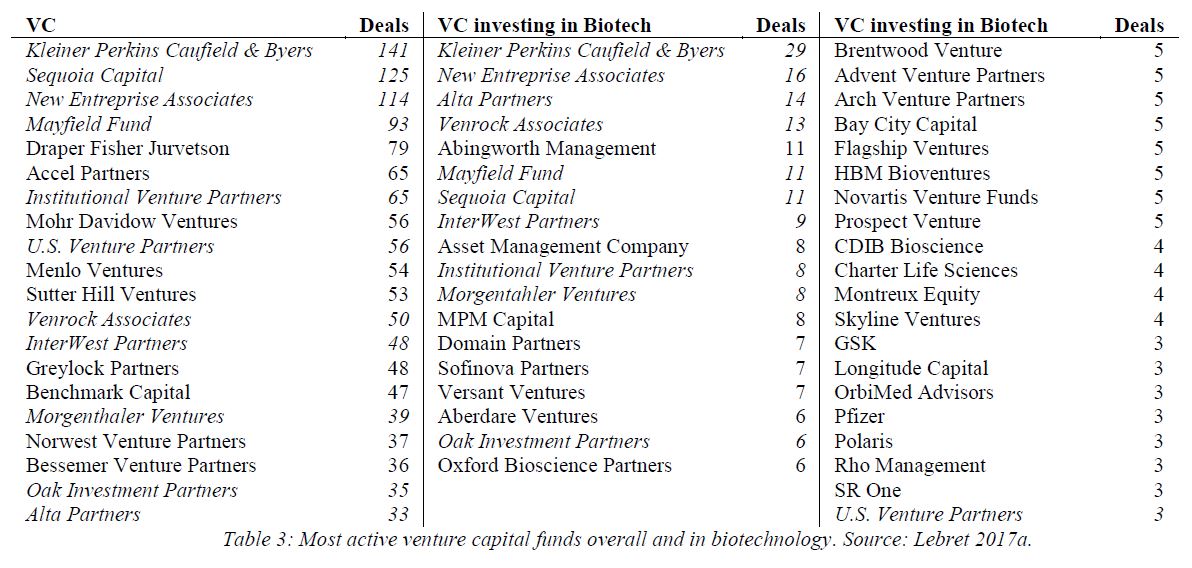
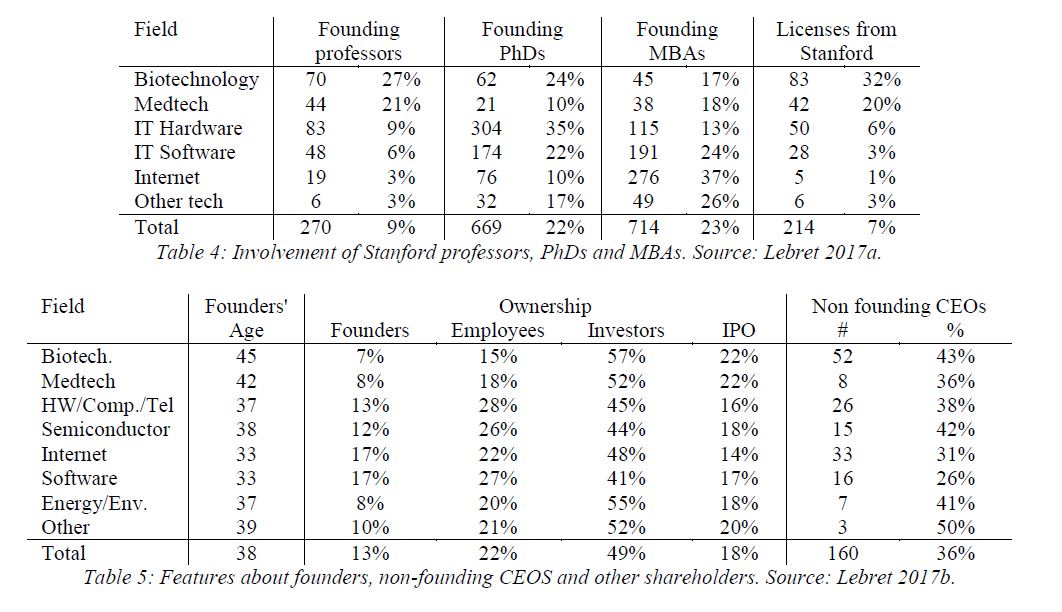
Are Biotechnology Startups Different?

This is a research work I did recently and after trying very shortly to publish it in academic papers, I stopped trying. Maybe it is not good enough. Maybe the research world and I do not fit! It is the result of two series of research I have done for years, one about Stanford-related spin-offs and another about equity in start-ups.

I encourage you to read it if the field is of interest for you or just have a look at the tables below which I extracted from this 5-page short document.

Finally, an explosion of new IPO filings in IT

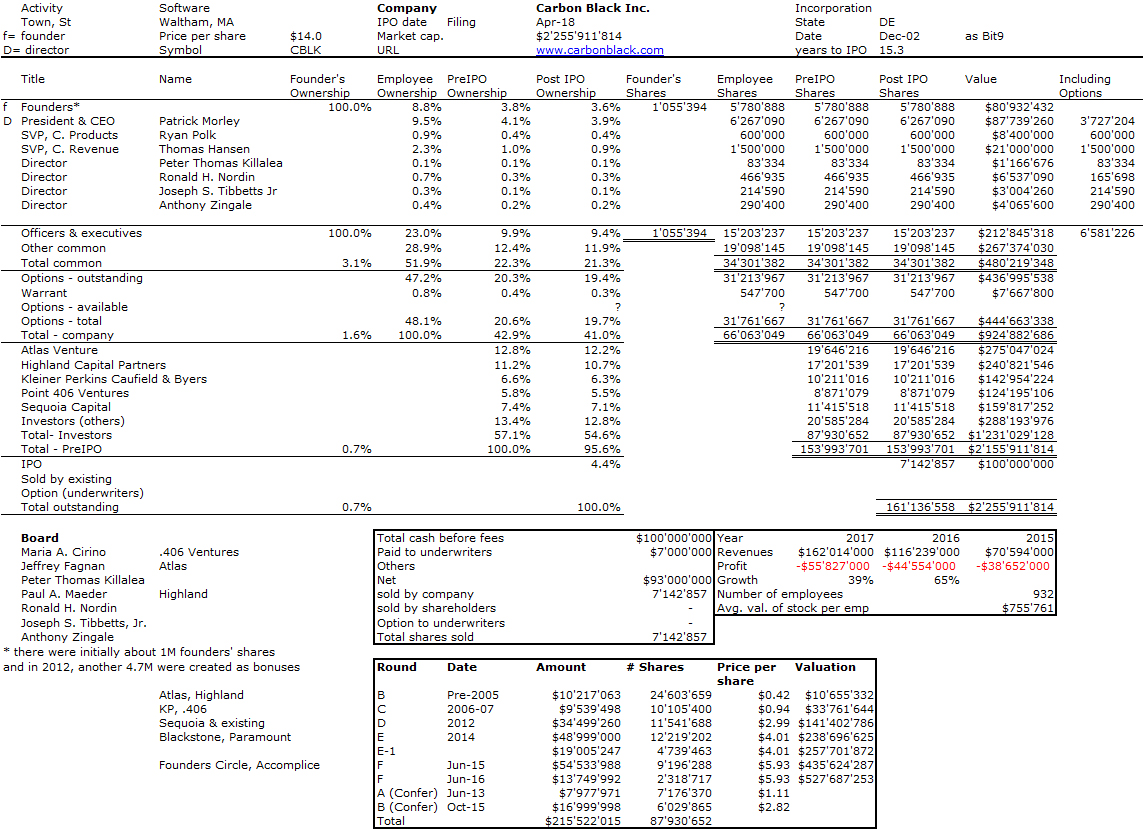
In the recent years, there had been regular filings in the biotech field, but IT had suffered. then Dropbox and Spotify filed and successfully went public. This probably gave confidence to “unicorns” and many have filed recently such as Smartsheet, DocuSign, Zuora. Carbon Black is the latest one with an interesting history. here is its S-1 filing and below my computed cap. table.

Carbon Black was founded in 2002, has raised close to $200M since inception (not counting the money raised by 4 startups is has acquired, Confer Technologies, Objective Logistics & VisiTrend). It has a royal list of VCs, including Kleiner Perkins, Sequoia, Highland, Atlas or lesser know funds such as .406 or Accomplice. I do not know who the founders were, but I could get the name of Todd Brennan who has left in 2008. Who else, help me! Finally the company is based close to Boston, not in Silicon Valley… This is just the latest of my compilations, that you may find in a previous post Equity in Startups.

Do Ex-Startup Founders Make The Best Venture Capitalists? (Part 2)

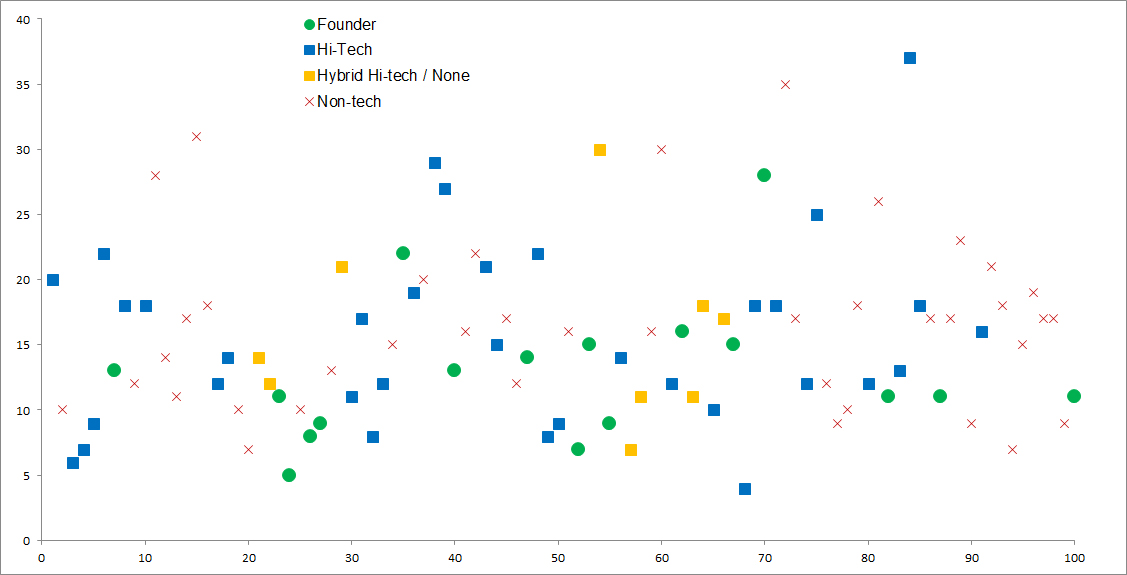
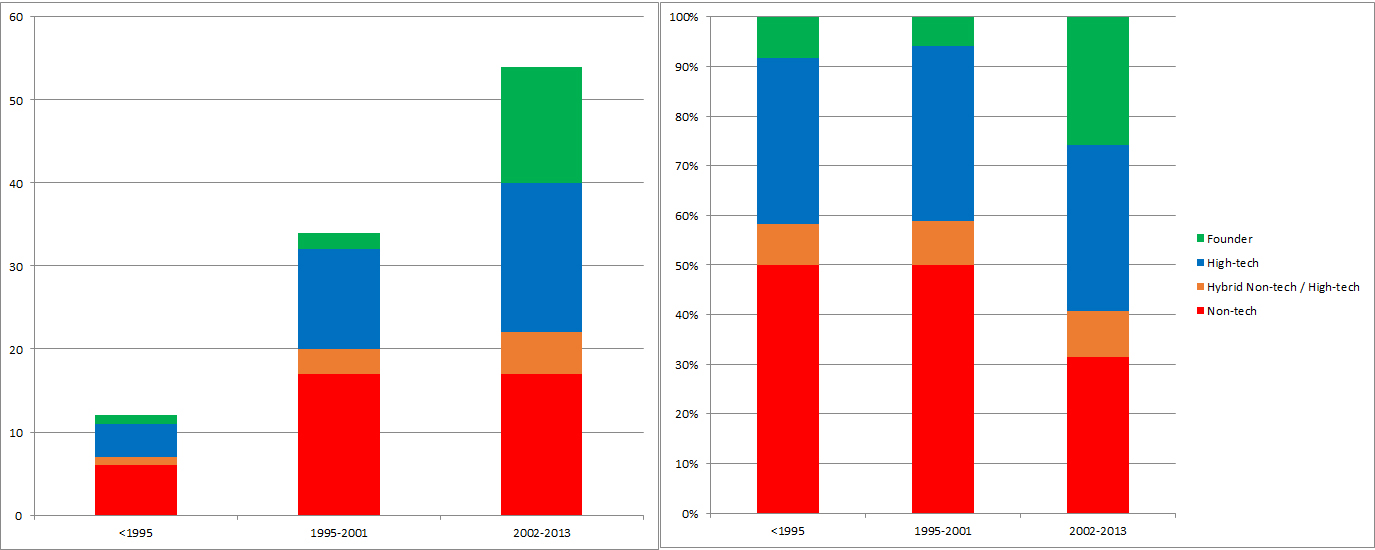
Yesterday, in Do Ex-Startup Founders Make The Best Venture Capitalists? I mentioned CB Insights analysis about the background of the top VCs, and expressed my doubts about comparing founders vs. non founders. So I used the Top100 list and had a different look: what about the background in high-tech or not? Here are some charts. Quick and dirty so do not take it as a scientific analysis. Still…

First a point of caution. This list is a little strange and the authors know better than me, but I am sure this list is not highly subjective… Now it seems founders were never a majority and VCs with no high-tech experience always a majority. Now what is puzzling is that these VCs are rather young and that a high majority of them having been in the business for less the 20 years… interesting. What would have been the results of the VCs active in the 70s and 80s? Not sure…

Also the change in the last 15 years is not the ratio with a tech background, but the ones who are founders has increased and the ones with no tech background has decreased…