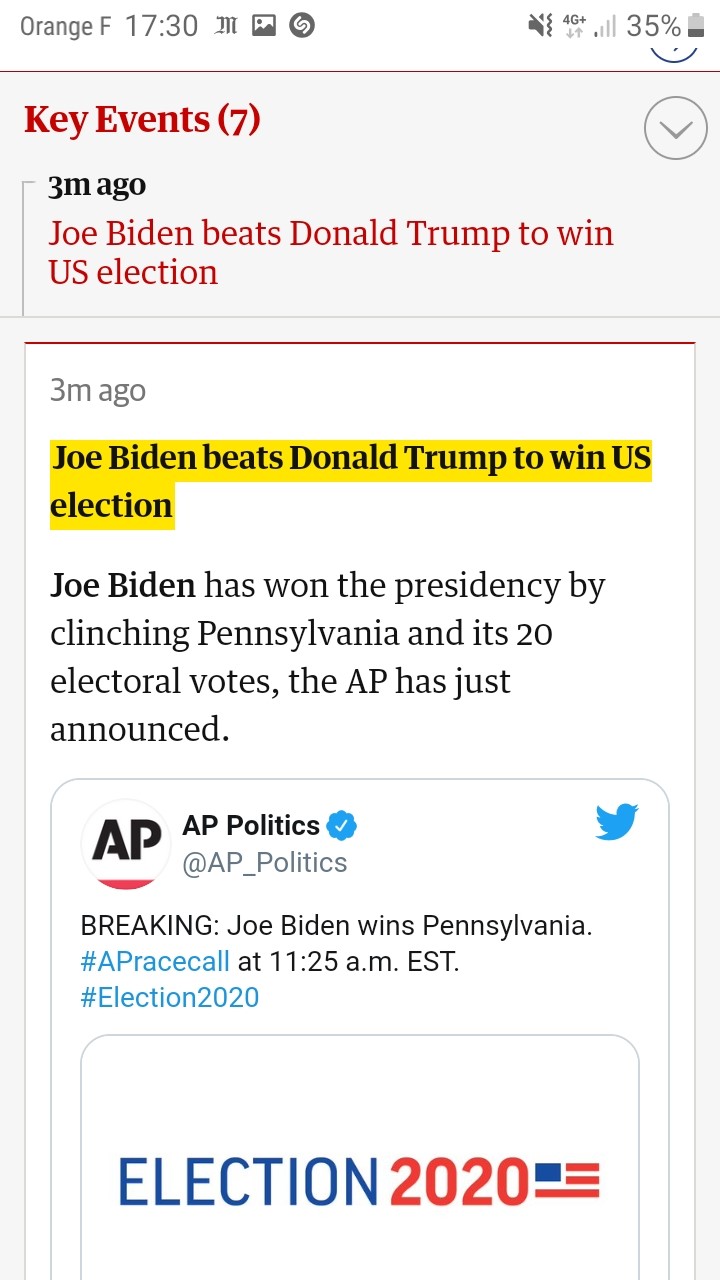
As I mentioned in my previous post, I was a little desperate to find specific information about Intersil that would allow me to illustrate its shareholding when it went public.
You can skip this very anecdotal narrative which is probably above all an archive for me, but which also shows that you always have to persevere. Note that each country has a register of companies, more or less rich in information, sometimes for a fee, sometimes free. In the USA, the Security and Exchange Commission (SEC – www.sec.gov) provides access to all documents about public companies (i.e. listed on a stock exchange). In contrast, private companies (not listed on a stock exchange) are not obliged to publish any information, especially financial. (And I would add that Private Equity – of which venture capital is a part – only finances private companies, i.e. unlisted).
The SEC provides a service – EDGAR – free of charge for all documents published up to the mid-1990s, 1996 to be precise, I think. The SEC sold the pre-1996 documents for around $40-60 and then handed the service over to Thomson Reuters (then Refinitiv) a few years later – a privatization of “public service” and the price rose to $80 then $120-140 per document…
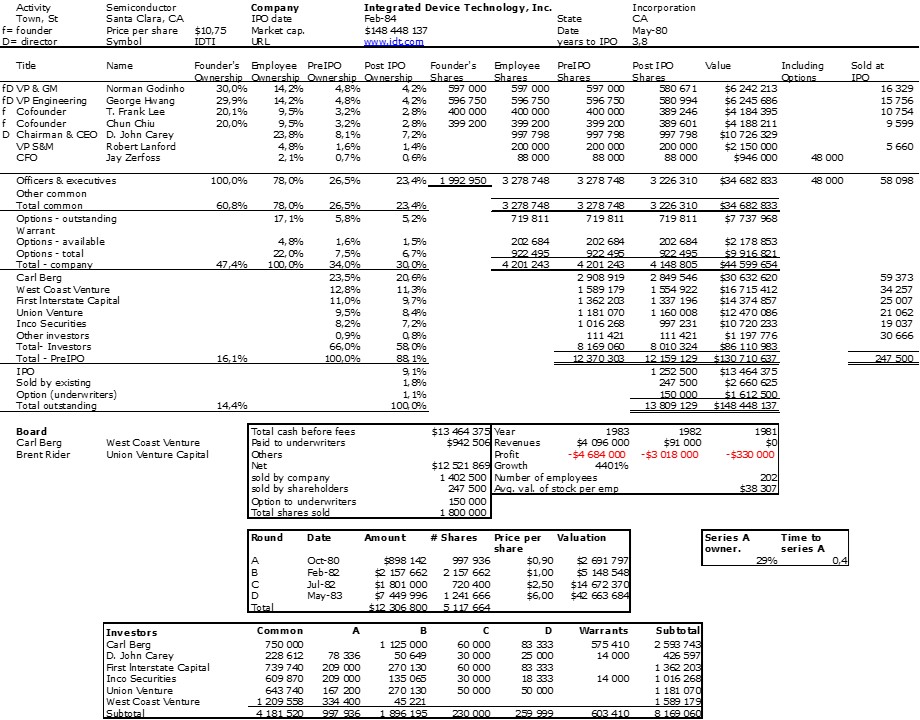
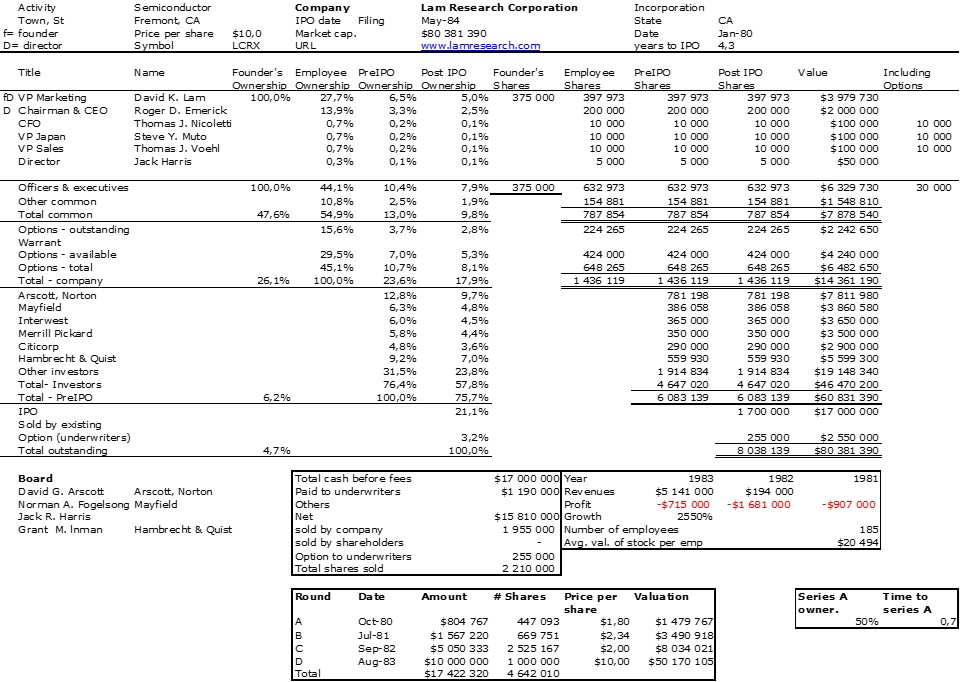
On October 4, I contacted Thomson Reuters asking for the IPO prospectuses of IDT, Lam Research and Intersil.
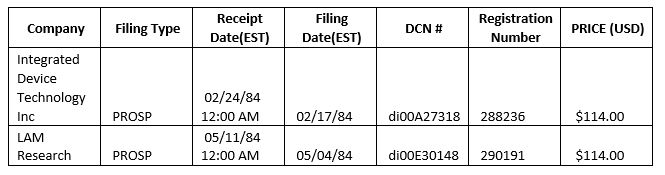
While I got the first two almost immediately, on October 7 I got a question as an answer for Intersil that asked me to choose a document from the following table:
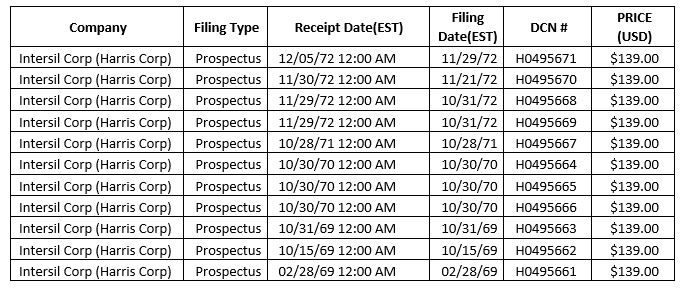
The question was unsettling because Intersil was not Harris and I wanted a document dated 1972. There should not have been earlier documents.
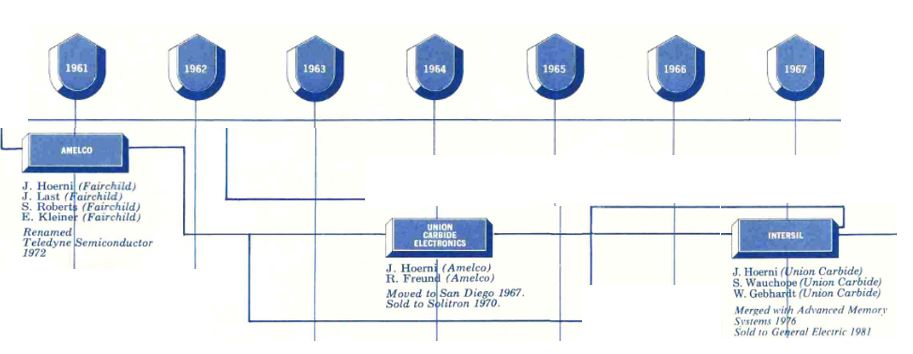
Intersil was founded in 1967, went public in 1972 and was reportedly acquired in 1981 by General Electric (GE) and in 1988 by Harris (that’s it!) which combined Intersil with units from RCA and GE. In 1999, Harris made Intersil a spin-off which went public again in 2000… In 2017, Japanese company Renesas bought Intersil.
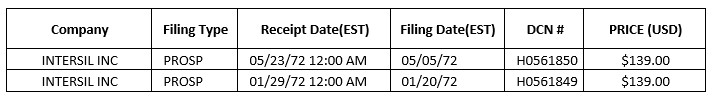
In explaining this situation to the SEC, a second research led them to offer me these documents:
Buying 2 documents at that price made me hesitant. So I needed more information. I contacted individuals:
– Christophe Lecuyer, author of Making Silicon Valley, Innovation and the Growth of High Tech, 1930-1970
– David Fullagar, formerly at Intersil,
– Michelle Lowry at Drexel University,
– Josh Lerner and Paul Gompers at Harvard University,
– Jay Ritter at University of Florida,
as well as institutions:
– The Computer History Museum in San Jose, CA (https://computerhistory.org/)
– The libraries of Stanford University, Harvard University
– The WRDS service at Wharton (Wharton Research Data Services), the business school of the university of Pennsylvania
Most answered even if they had no information. This is the American culture: people try to help, often by giving new names or leads. I must in particular thank Jay Ritter who wrote back immediately: “My records have Intersil going public on Jan 20, 1972 at $14 per share. The first market close may have been $12.00. But I have less information about this company than most IPOs from 1972.” then later “In another file I found that it had ticker ISIL, listed on Nasdaq, might have been a General Electric spinoff, but was VC-financed with Diebold Venture Capital Corp., RCA Corp., Sutter Hill Ventures, Bessemer Venture Partners, Mayfield II, Citicorp Venture Capital, and Small Business Enterprises (Bank America) as investors, Bache was the lead underwriter, and sold 360,000 shares at $14 per share (352,000 newly issued, with 8,000 from selling shareholders).”
Interestingly there are mixed information about 2 different IPOs not to say companies. But I had my date! January 20, 1972.
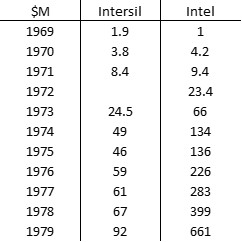
On October 11, I could contact again Refinitiv and my contact answered “Please allow at least 2-3 hours for this process.” The next day, “They need to scan the microfiche for the document of Intersil. [But] it seems that they are having trouble on finding it.” And the next day, I finally had it which made possible the next table:
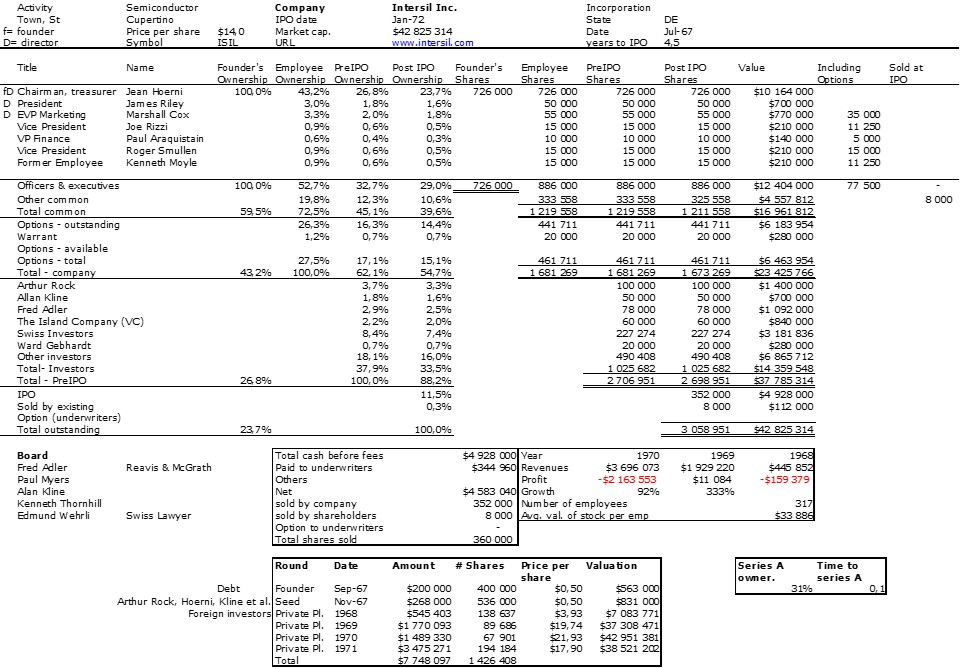
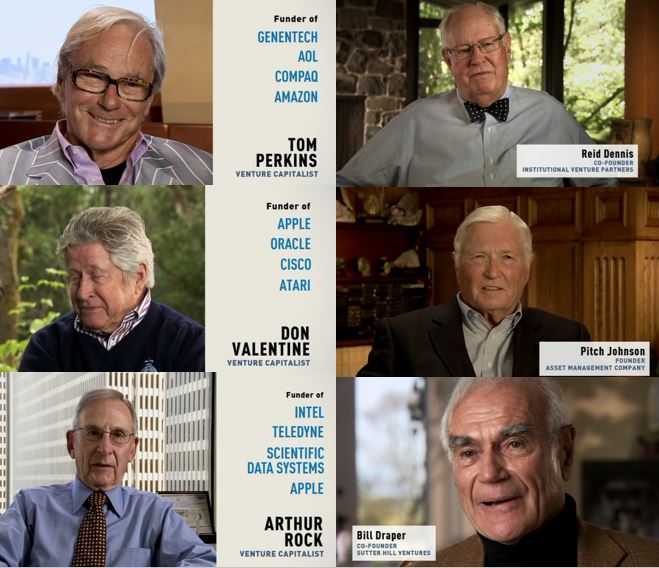
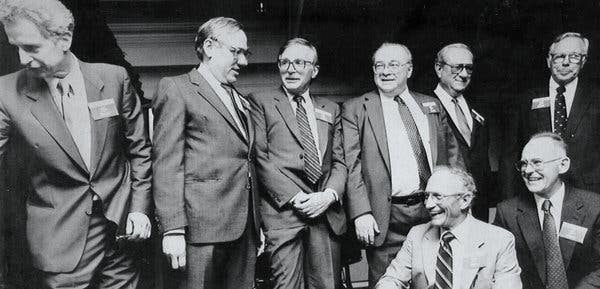
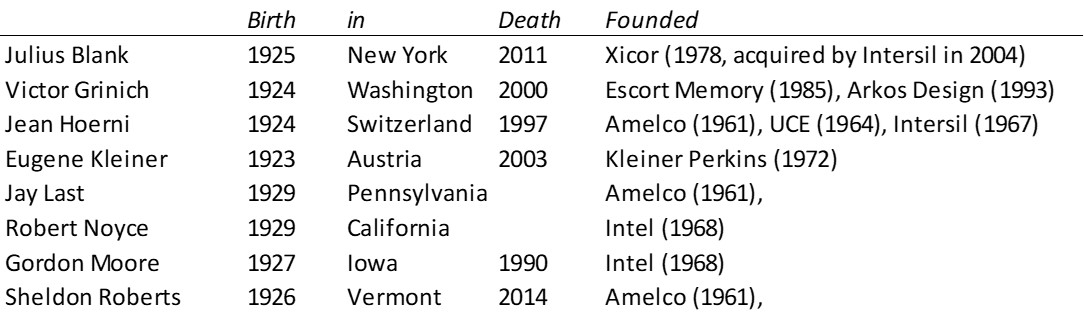
Remember Bauer and Wilder have dedicated their book to Jean Hoerni : “This book is dedicated to Jean Hoerni, the inventor of the planar process; without which none of this would have been possible. Hoerni became an entrepreneur and owned about a quarter of Intersil IPO. This is uncommon and huge for a founder. You my not know the investors, this was the sixties. But Arthur Rock is a legend (an investor in Intel, Apple – see my next post!) and Fred Adler is also famous, though to a lesser extent. These were the early days of startups and venture capital, but fundamentally, everything was being invented then and the rules are pretty much the same today.