Category Archives: Start-up data

Finally, an explosion of new IPO filings in IT

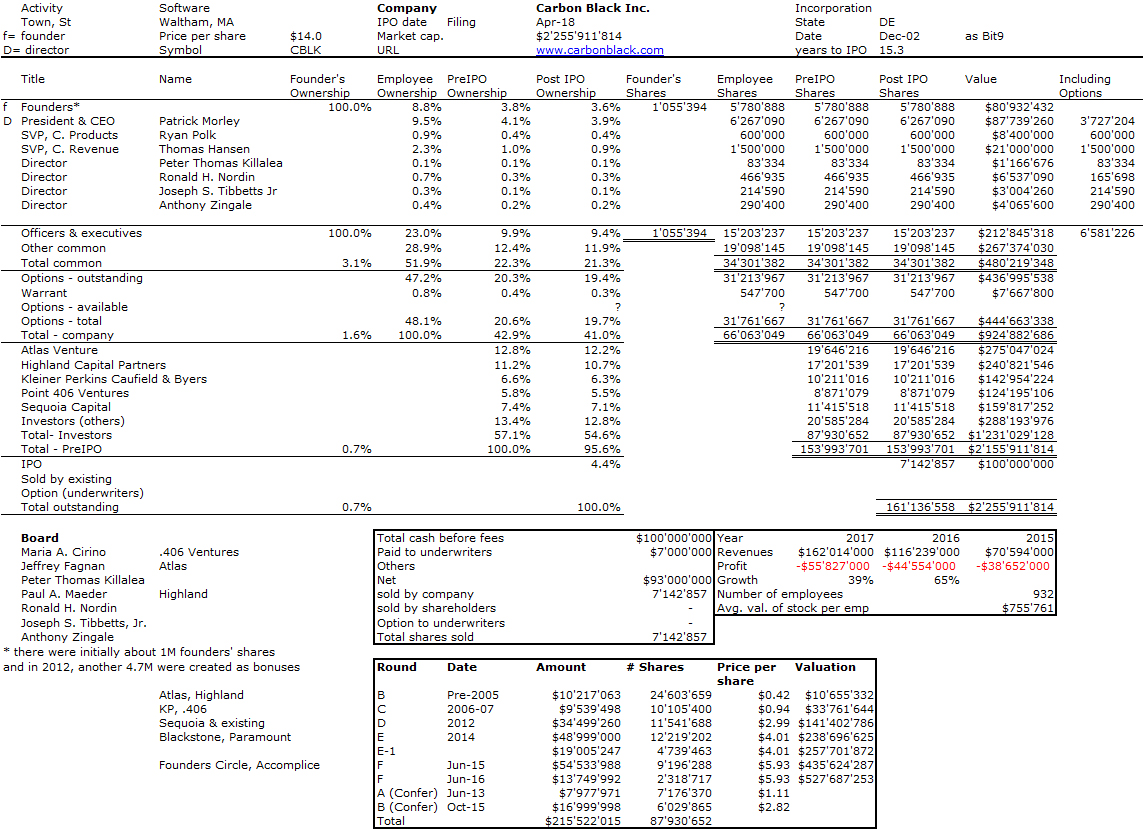
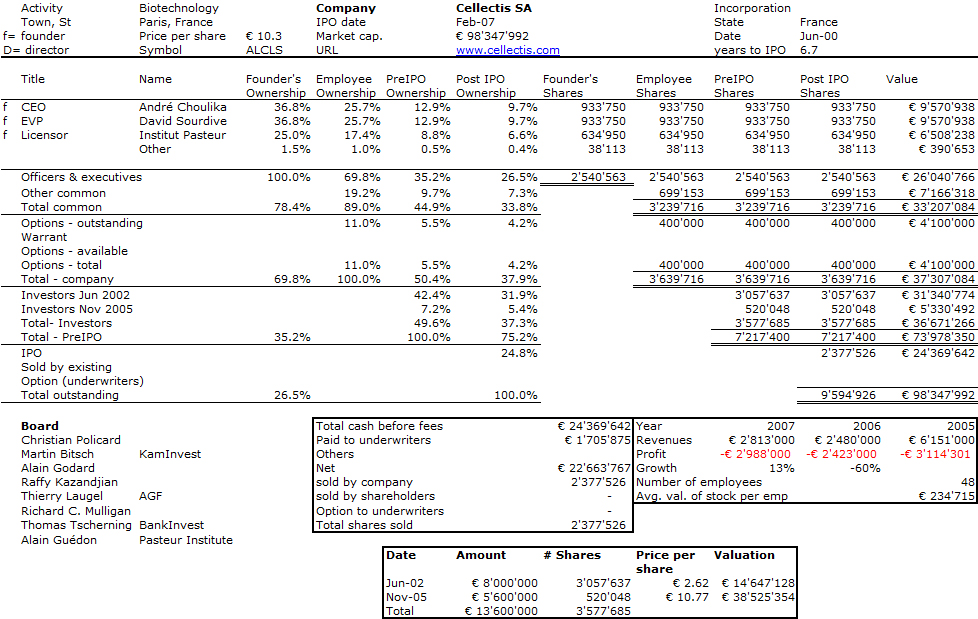
In the recent years, there had been regular filings in the biotech field, but IT had suffered. then Dropbox and Spotify filed and successfully went public. This probably gave confidence to “unicorns” and many have filed recently such as Smartsheet, DocuSign, Zuora. Carbon Black is the latest one with an interesting history. here is its S-1 filing and below my computed cap. table.

Carbon Black was founded in 2002, has raised close to $200M since inception (not counting the money raised by 4 startups is has acquired, Confer Technologies, Objective Logistics & VisiTrend). It has a royal list of VCs, including Kleiner Perkins, Sequoia, Highland, Atlas or lesser know funds such as .406 or Accomplice. I do not know who the founders were, but I could get the name of Todd Brennan who has left in 2008. Who else, help me! Finally the company is based close to Boston, not in Silicon Valley… This is just the latest of my compilations, that you may find in a previous post Equity in Startups.

Sensirion prepares its IPO

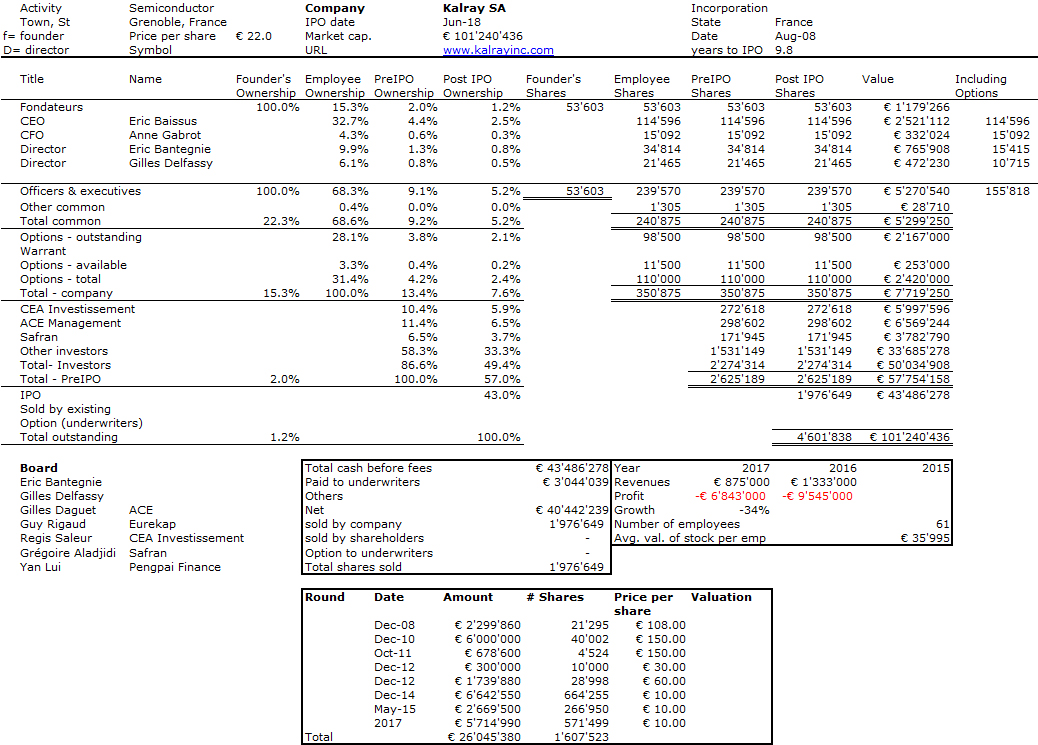
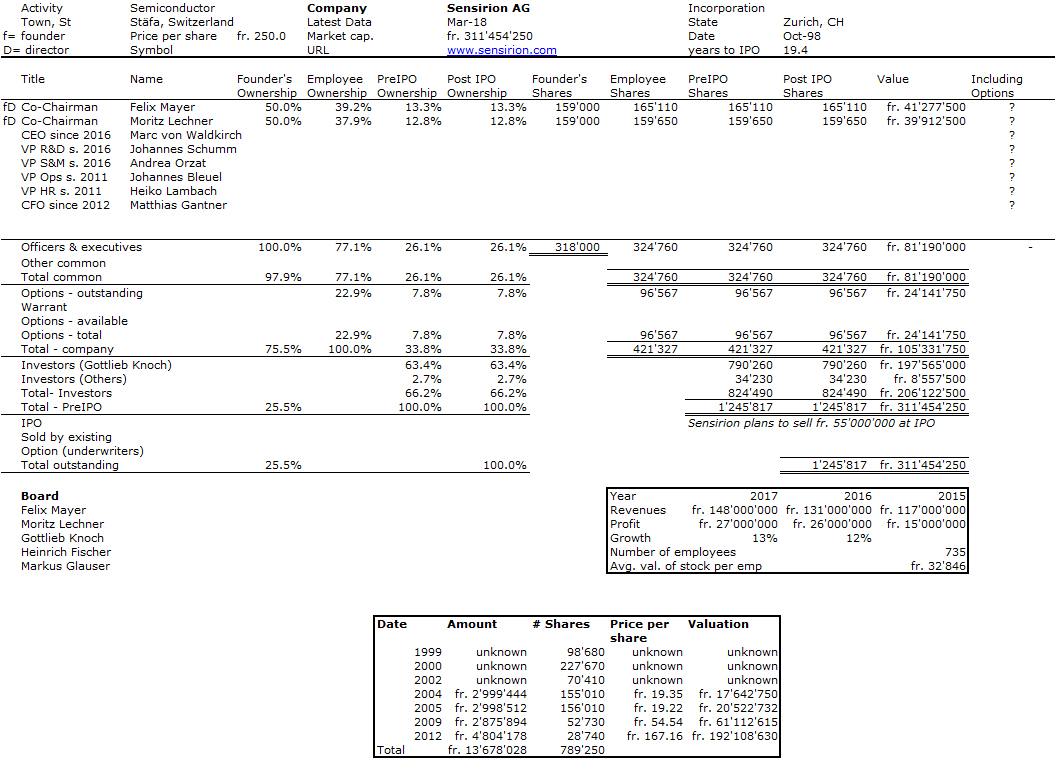
Sensirion finally announces its IPO. The spin-off from ETH Zurich was founded in 1998 and many were expecting such an event from a very succesful but quite discrete company. Sensirion has disclosed some numbers and I had followed the development of the company thanks to some data from the Zurich register of commerce. So as usual here is my guess of the capitalization table. And I look forward to compare it with the data from the IPO prospectus when it will be published…


Felix Mayer and Moritz Lechner, co-founders of Sensirion

Again this is guessing only. As you might see, the early funding rounds are unknown to me. I am not sure about how many shares the founders, main investor and employees have adn I am not sure either at which price the company will be priced. I based my numbers on about twice the company sales in 2017… The company claims Knoch has 55% of the company, the founders 14% and employees 8.5%. It does not look to far…

The Sensirion IPO prospectus is not public and is confidential so I cannot publish more than I have here. I can only write I was not too far from the truth despite some discrepancy…

And Now Spotify

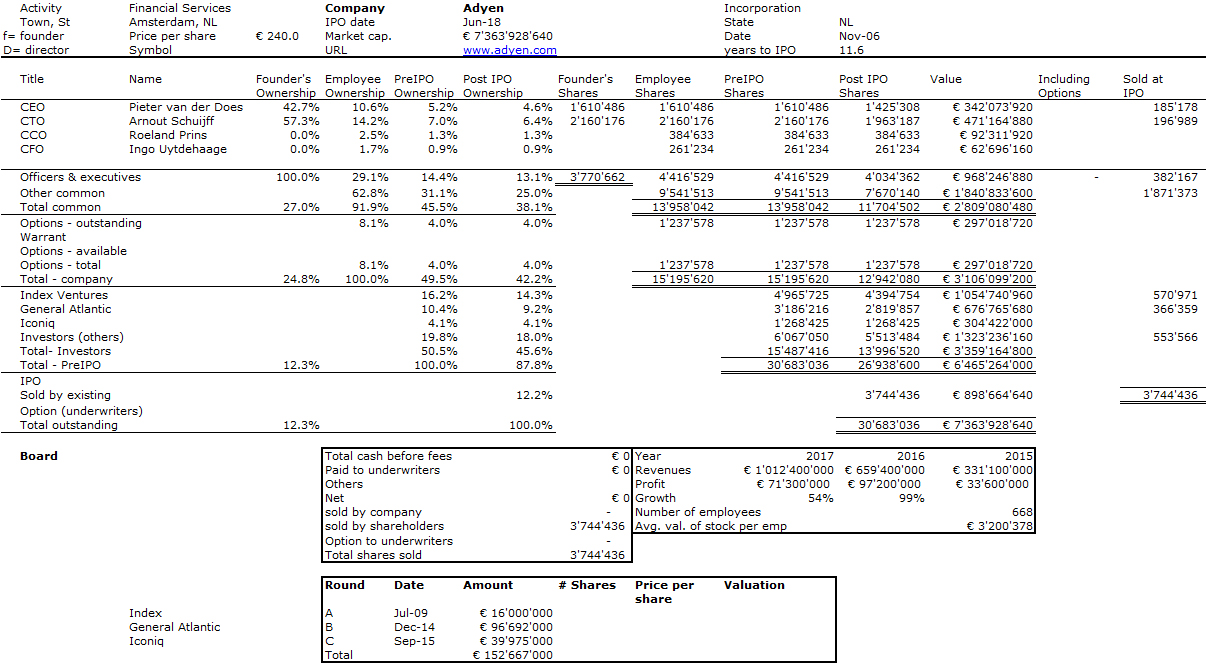
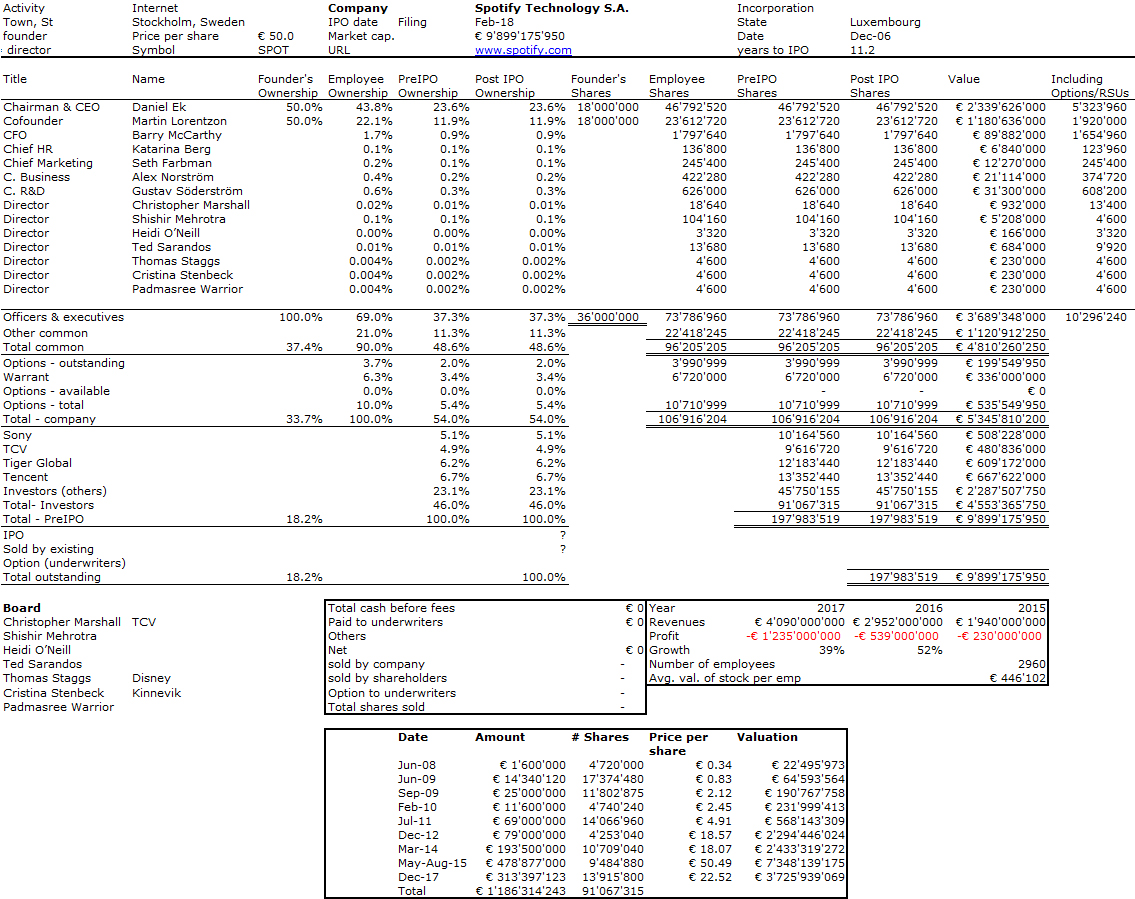
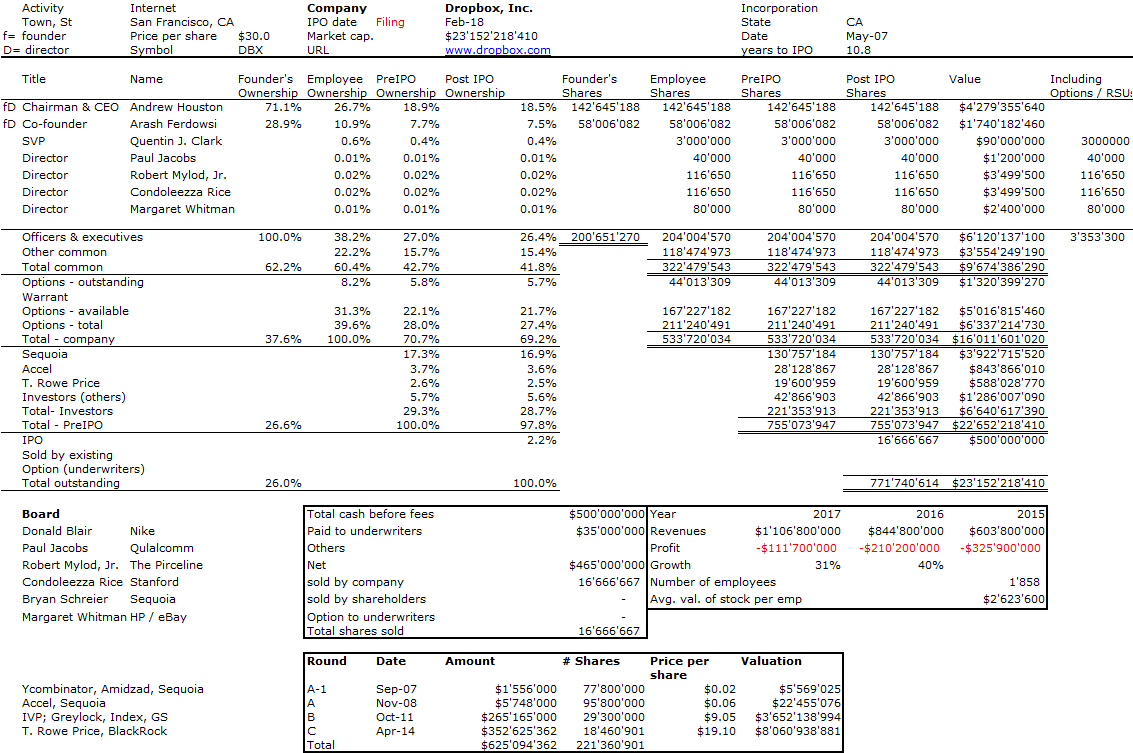
A few days after Dropbox filing for an IPO, here is Spotify. Their F-1 can be found here. The data from the filing document is not exhaustive enough for me, many pas financing rounds are not described but the Luxembourg register of commerce helps too.


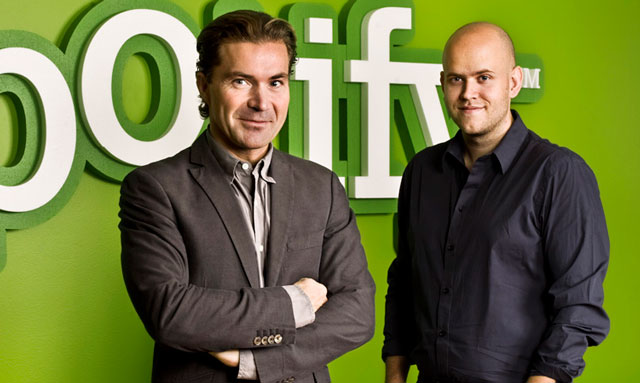
Spotify founders Martin Lorentzon and Daniel Ek

Just like for Dropbox, this is a filing only, so the price per share is tentative and the valuation is not fixed yet. The price per share could probably go from €20 to €100…

Rewarding Talent – A guide to stock options for European entrepreneurs by Index Ventures

I recently read an article mentioning a new report by Index Ventures Rémunération du risque : la France s’en sort bien ! and a few days later a student of mine mentioned a new app by Index to help entrepreneurs allocate stock options: Index Ventures Option Plan beta. Thanks Javier! I had a look, tweeted about it and then thought it was worth a blog article…
I advise you to read the full (143-page) report – link here. It includes great information at the macro (national policy) and micro (startup) level. There are minor differences with my past analyses such Equity in Startups published in Sept. 2017 or my recurrent class about Equity Split in Startups which you can find here:

What is particularly interesting, I think, is their summary:

1 European employees own less of the companies they work for than US employees. For late-stage startups, they own around 10%, versus 20% in the US.

2 Ownership levels vary much more in Europe than the US. In Europe, employee ownership in late-stage startups ranges from 4% to 20%. In the US, ownership is more consistent, as stock option allocation is driven by market forces.

3 Employee ownership correlates to how deeply technical a startup is. An AI or enterprise software startup requires more technical know-how than a straightforward e-commerce startup. These employees are more likely to seek stock options.

4 Ownership policy details adopted by startups vary between the US and Europe. For example, provisions for leavers, and accelerated vesting following a change in control.

5 In Europe, stock options are executive-biased. Two-thirds of stock options are allocated to executives, and one third to employees below executive level. In the US, it’s the reverse.

6 European employees still don’t expect stock options much of the time. US employees joining a tech startup with fewer than 100 staff would typically expect stock options straight away. This is much less true in Europe, although expectations are steadily rising.

7 European option holders are often disadvantaged. In much of Europe, employees will be paying a high strike price, and they will be taxed heavily upon exercise as well as sale. Leavers often get nothing.

8 There is wide variation in national policy across Europe, with the UK most supportive of employee ownership. Regulations and tax frameworks are radically different across Europe. The UK’s EMI scheme is most favourable, better than what is available in the US, and France is also good. Other countries, including Germany, lag behind in our opinion.

The top US and European (former) start-ups in 2017

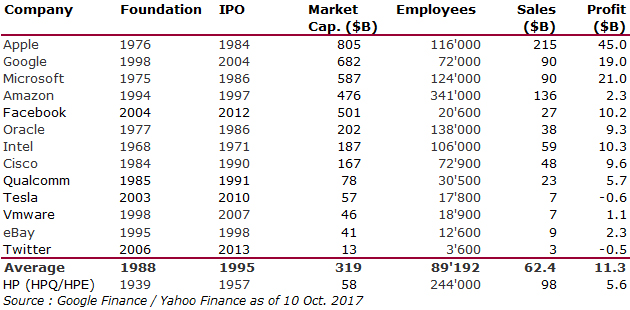
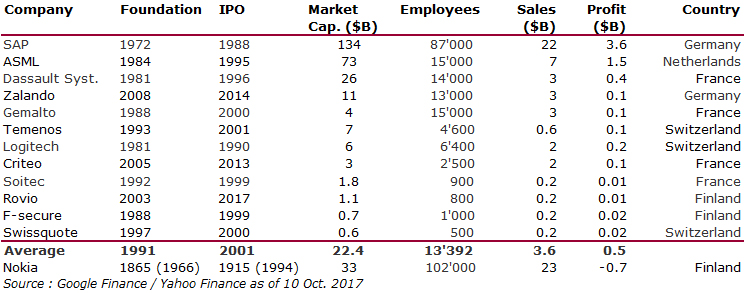
Since I published my book in 2007, I have regularly been doing the exercise of comparing the largest US (former) start-ups and their European counterparts. You can look at my data in 2016 in The top US and European (former) start-ups in 2016. Here are my update lists:

Things have not changed that much. Yahoo is out. Rovio is in…

Rovio (Angry Birds) is going public

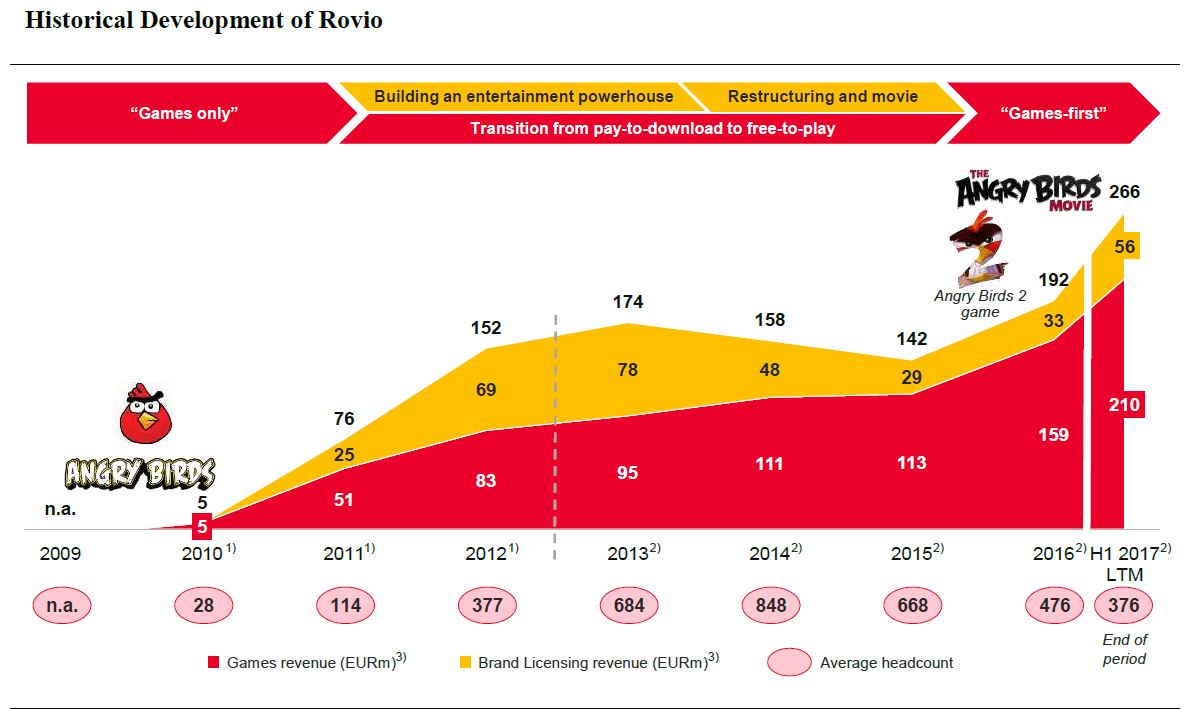
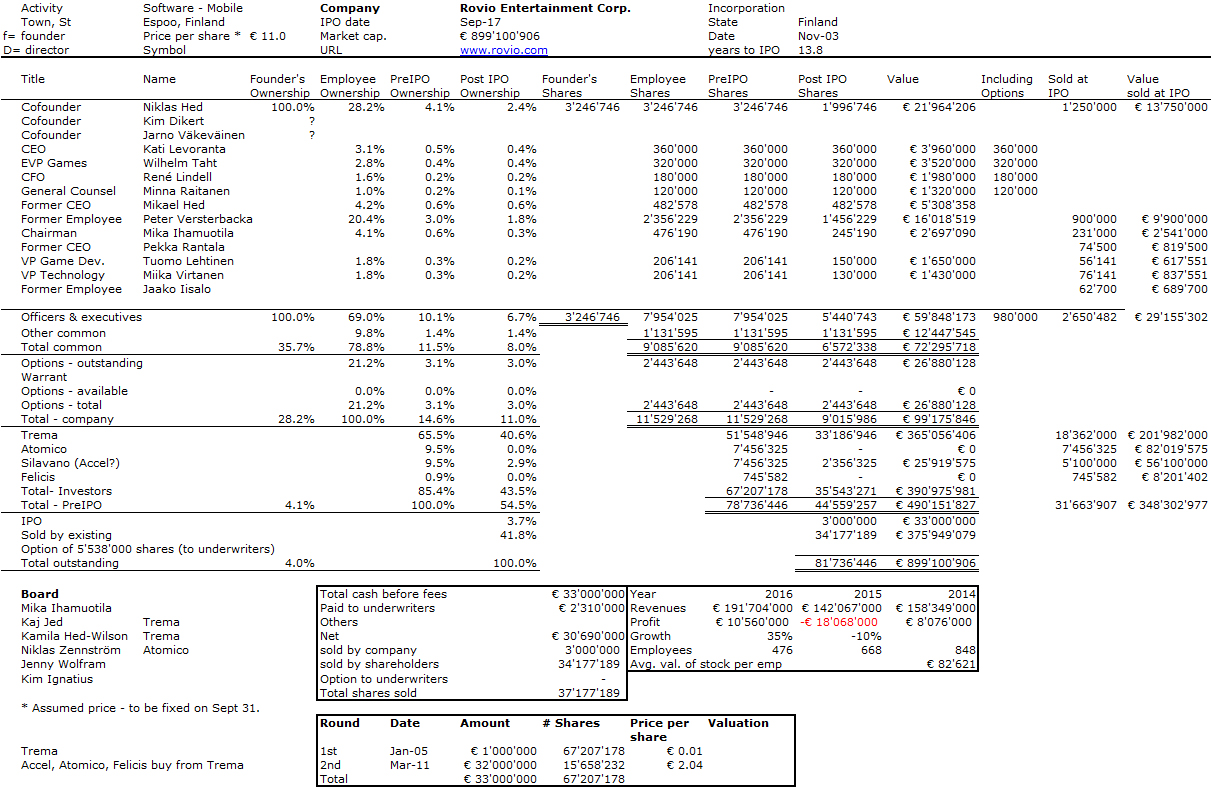
Rovio, the Finnish start-up creator of the famous Angry Birds game, will fly to the Helsinki Stock Exchange next week. Apparently it should be a success as the offer is oversubscribed and has just been closed despite the recent challenges the start-up had to face, as the next figure shows.

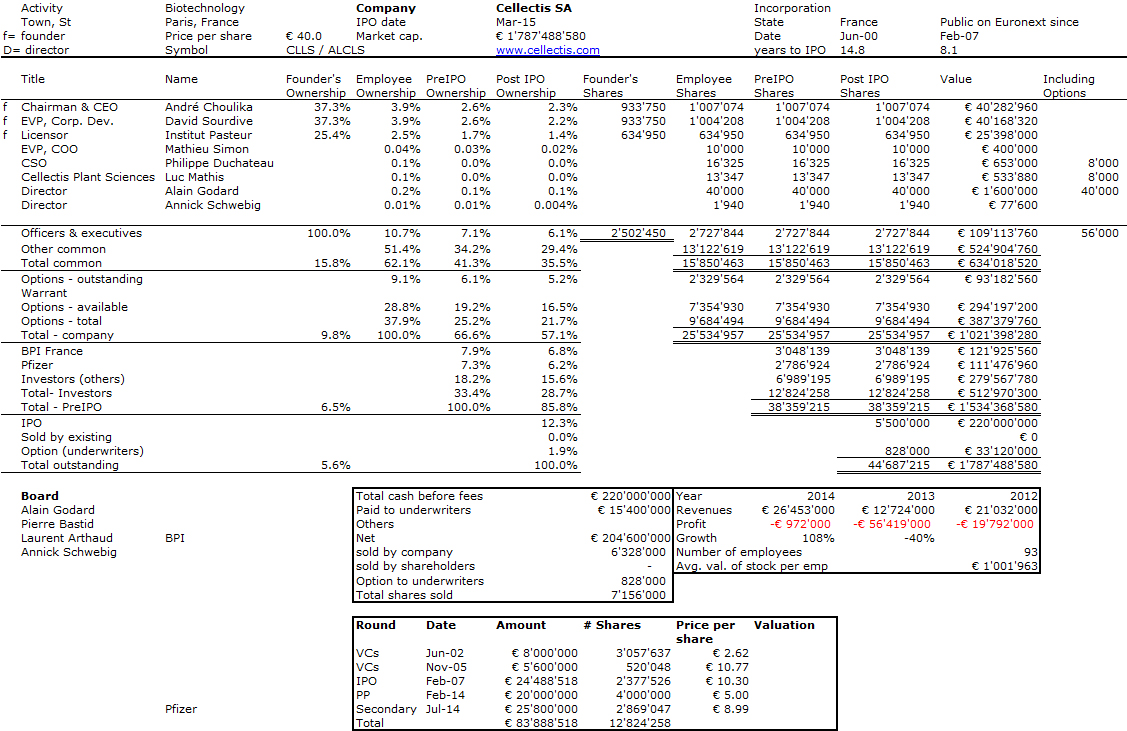
I will not comment more but just add my usual capitalization table.

Equity in Startups

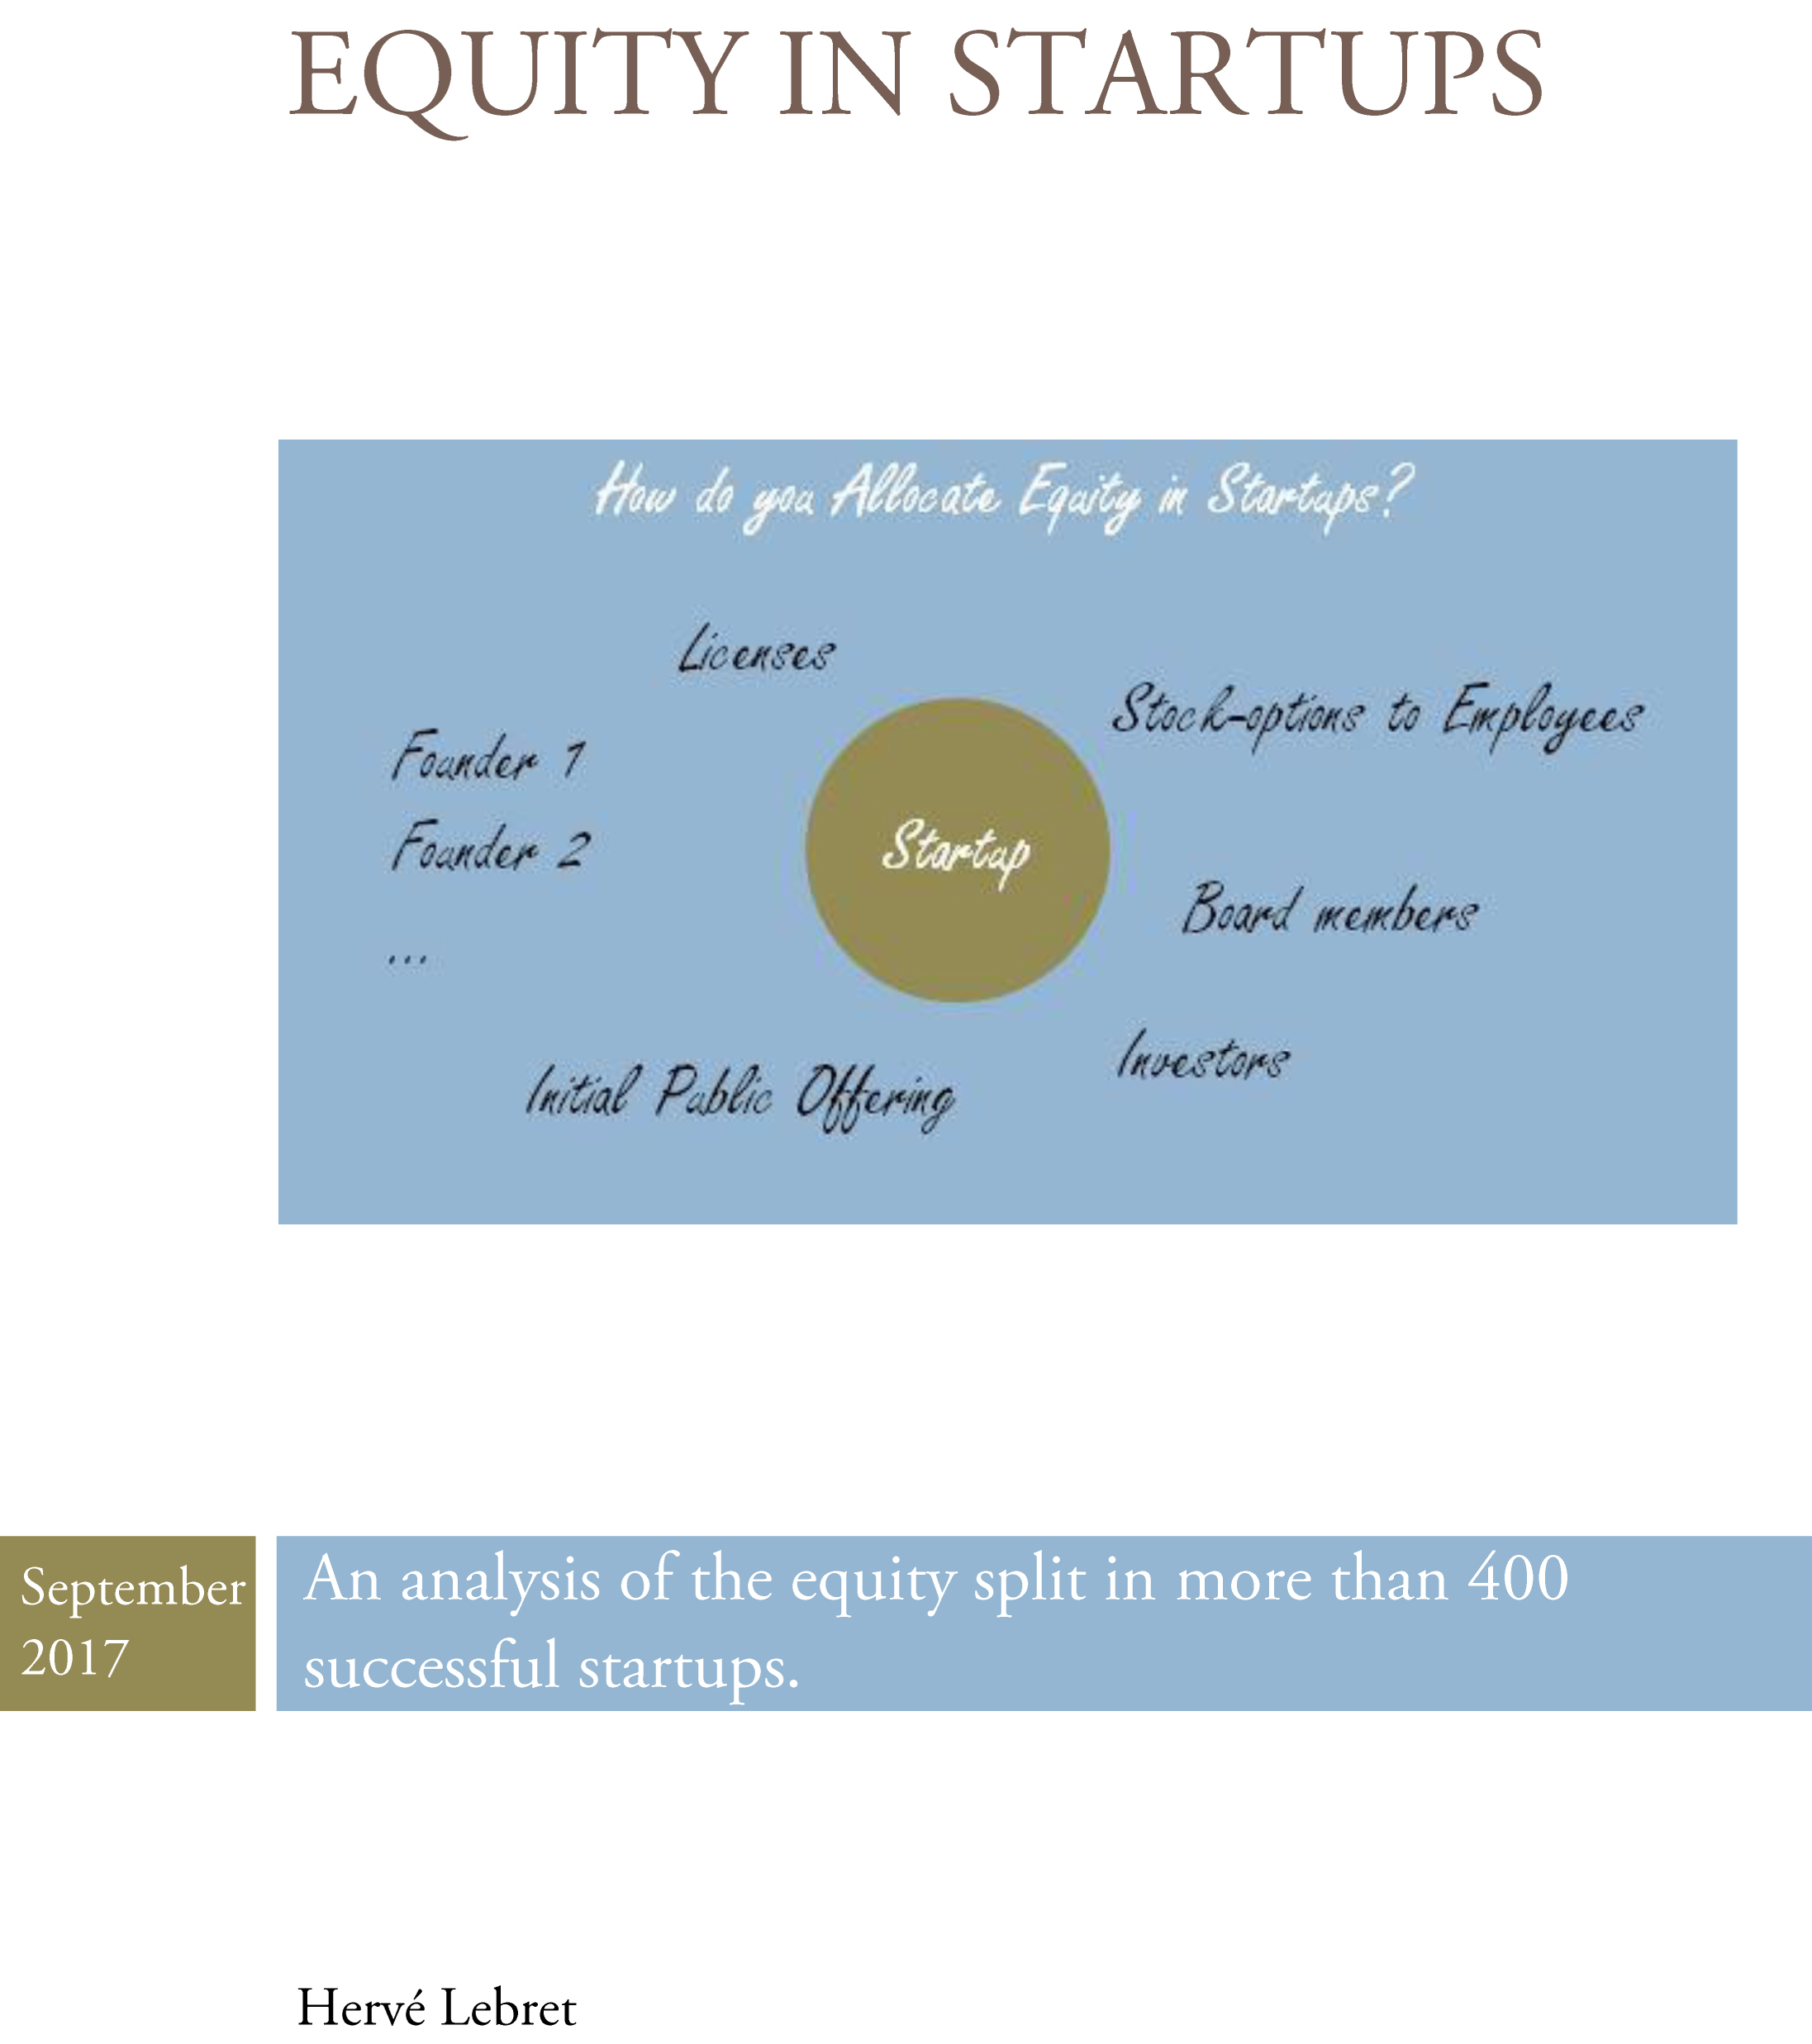
This is the third short report I publish this summer about startups. After Startups at EPFL and Stanford and Startups, here is (I hope) an interesting analysis about how equity was allocated in 400 startups, entitled Equity in Startups (in pdf). Here is the description of the report on its back page: Startups have become in less than 50 years a major component of innovation and economic growth. An important feature of the startup phenomenon has been the wealth created through equity in startups to all stakeholders. These include the startup founders, the investors, and also the employees through the stock-option mechanism and universities through licenses of intellectual property. In the employee group, the allocation to important managers like the chief executive, vice-presidents and other officers, and independent board members is also analyzed. This report analyzes how equity was allocated in more than 400 startups, most of which had filed for an initial public offering. The author has the ambition of informing a general audience about best practice in equity split, in particular in Silicon Valley, the central place for startup innovation.

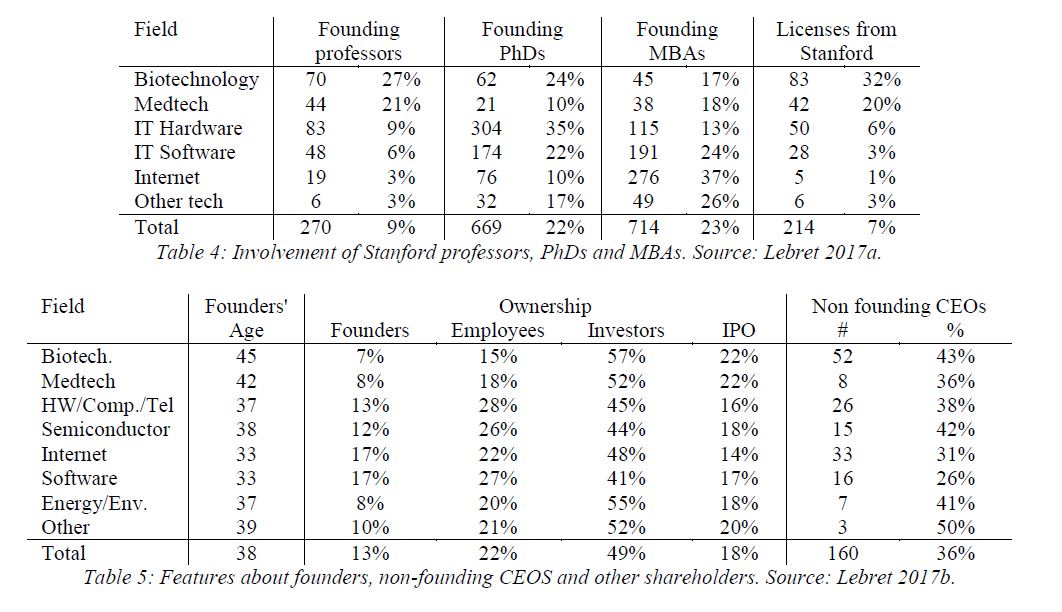
I will let you (hopefully) discover this rather short report which could have been much longer if I had decided to analyze the data in detail. I will just right here my main results. A simple look at data shows that at IPO (or exit) founders keep around 10% of their company whereas investors own 50% and employees 20%. The remaining 20% goes to the general public at IPO . Of course, this is a little too simplistic. For examples founders keep more in Software and Internet startups and less in Biotech and Medtech. There could be a lot more to add but I let the reader focus on what possibly interests her.
Additional interesting points are:
– The average age of founders is 38 but higher in Biotech and Medtech and lower in Software and Internet.
– It takes on average 8 years to go public after raising a total of $138M, including a first round of $8M in VC money.
– On average, companies have about $110M in sales and are slightly profitable, with 500 employees at IPO time. But again there are differences between Software and Internet startups which have more sales and employees and positive income and Biotech and Medtech startups which have much lower revenue and headcount and negative profit.
– The CEO owns about 3% of the startup at exit. This is 4x less the founding group and depending when she (although it is too often a “he”) joined it would mean up to 20% close to foundation (assuming the founders would keep 80% and allocate the delta to the CEO)
CEOs are non-founders in about 36% of the cases, more in biotech (42%) and Medtech (35%) than Internet (31%) and Software (25%), more in Boston (48%) than Silicon Valley (43%) .
– The Vice-Presidents and Chief Officers own about 1% and the Chief Financial around 0.6%.
– Finally, an independent director gets about 0.3% of the equity at IPO. If we consider again that the founders are diluted by a factor 8x from their initial 100% to about 12%, it means a director should have about 2-3% if he joins at inception.
– In the past universities owned about 10% of a startup at creation in exchange for an exclusive license on IP. More recently, this has been more 5% non-diluted until significant funding (Series A round).

Stanford and Startups

Stanford is in the top2 universities with MIT for high-tech entrepreneurship. There is not much doubt about such statement. For the last ten years, I have been studying the impact of this university which has grown in the middle of Silicon Valley. After one book and a few research papers, here is a kind of concluding work.

A little less than 10 years ago, I discovered the Wellspring of Innovation, a website from Stanford University listing about 6’000 companies and founders. I used that list in addition from data I had obtained from OTL, the Stanford office of technology licensing as well as some personal data I had compiled over years. The report Startups and Stanford University with subtitle “an analysis of the entrepreneurial activity of the Stanford community over 50 years”, is the result of about 10 years of research. Of course, I did not work on it every day, but it has been a patient work which helped me analyze more than 5’000 start-ups and entrepreneurs. There is nearly not storytelling but a lot of tables and figures. I deliberately decided not to draw many conclusions as each reader might prefer one piece to another. The few people I contacted before publishing it here twitted about it with different reactions. For example:

Katharine Ku, head of OTL has mentioned another report when I mentioned mine to her: Stanford’s Univenture Secret Sauce – Embracing Risk, Ambiguity and Collaboration. Another evidence of the entrepreneurial culture of that unique place! I must thank Ms Ku here again for the data I could access thanks to her!

This report is not a real conclusion. There is still a lot to study about high-tech entrepreneurship around Stanford. With this data only. And with more recent one probably too. And I will conclude here with the last sentence of the report: “How will it develop in the future is obviously impossible to predict Therefore a revisited analysis of the situation in a decade or so should be very intersting.”

An analysis of EPFL’s Spin-offs and its Entrepreneurial Ecosystem

I usually do not mix my EPFL activity and my blog activity. This is one of the rare exceptions. At EPFL’s startup unit, we just published a short report describing EPFL spin-offs. Here is a short link. By the way you can also visit the pages about EPFL’s support to entrepreneurship.

The report gives data about value creation through fund raising and job creation and also about a known phenomenon, the importance of migrants for entrepreneurship. I am aware that value creation is a sensitive topic, all the more that in Europe venture capital has not proven a real correlation with value. It may even have destroyed more value than created any…