I regularly compile data about startups, mostly when they file to go public, when I can use their IPO prospectus (typically S-1 or 424B4 documents on Nasdaq). Thanks to a rush of IPOs this year (despite the covid) but also by revisiting older filings thanks to Jay Ritter great database of 11000+ IPOs since 1975, I could recently increase my own (much smaller) database of cap tables to 716 former technology startups (from 600 startups last April). This is a 20% or so increase, so it is quite a major update. Here is the document of all individual cap. tables:
Equity List – Lebret – Nov2020
You may prefer to download the pdf. And before reading the rest of the post, you may be interested in the analysis of the 600 startups last April : Updated data in equity of 600 (former) startups.
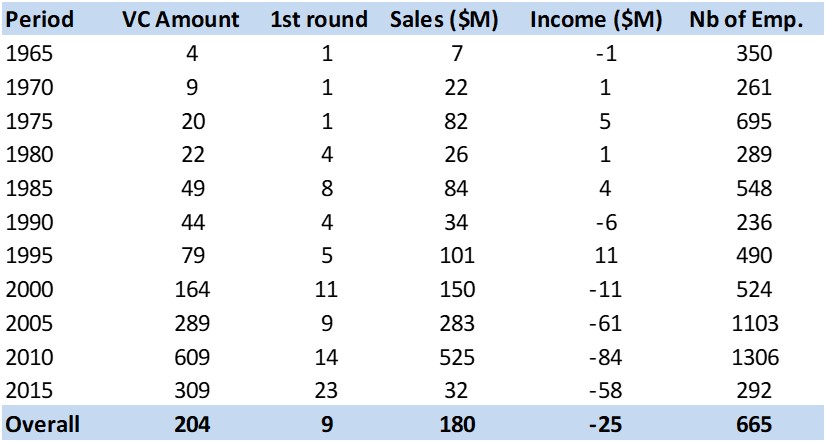
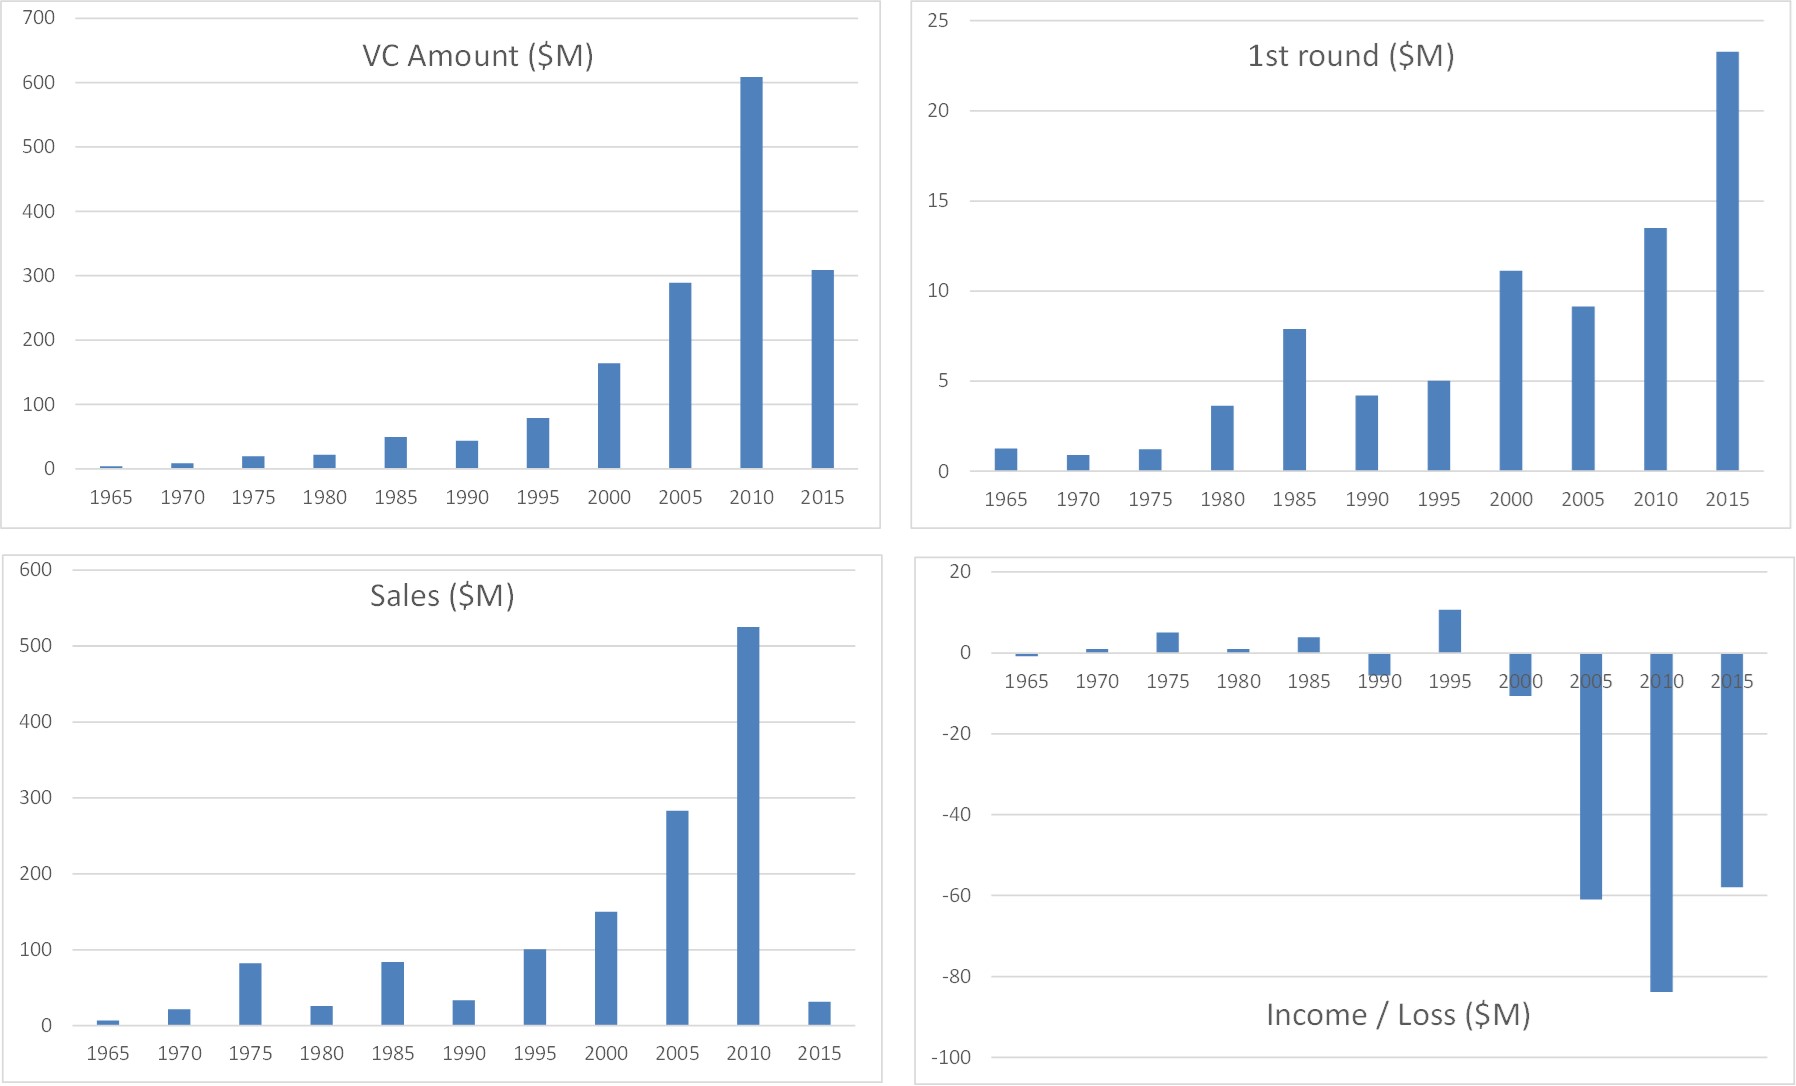
I will not go into the details of the data analysis, which would no doubt be similar to the 600 startups of last April. You can find the new stats beginning page 729 of the pdf. The evolution of the figures by period of 5 years is striking. It undoubtedly shows in part the evolution of the importance of technology but also the influence of venture capital in growth strategies. For better or for worse as I said in my previous article and as Philippe Labouchère said very well in Le Temps: These mega-investments that distort reality (Ces méga-investissements qui déforment la réalité).
Don’t be misled by the drop in the 2015 period. These very young companies who filed to go public are mostly biotech companies which have sligthly different dynamics. The IT companies which will file in the next years will be interesting to analyze: we’ll see if the trend continues or collapses…
One final element. Out of the 716 companies, 274 have been acquired and 383 are still public. The average M&A value is $3B and the median is $600M (remember the statistics of startups are not gaussian but follow a power law, a kind of “winner takes all” situation). Here is the list of the main acquirers:


