Following a recent post on the age of founders, I just did a more systematic analysis on the topic and at the same time analyzed more elements on the cap. table of many companies. I had 47 companies in my previous post. Here I just have 100!
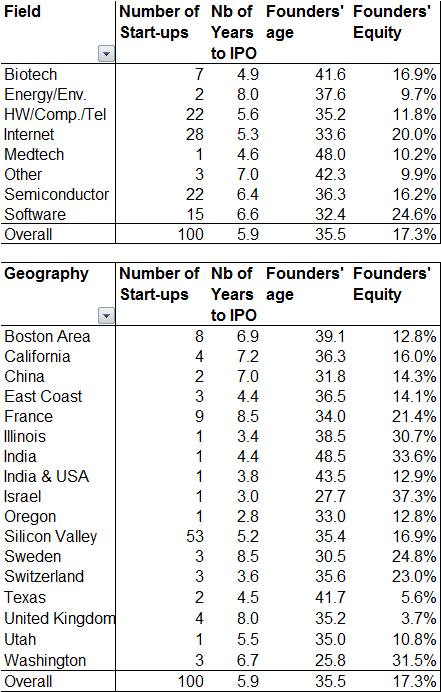
The two tables give the founders’ age, the number of years from foundation to IPO and the founders’ remaining equity at IPO by field and geography.
Now if you want to have a look at the full record, just click on the next picture, you will get a 107-page pdf with all data. But please be aware of some of the following difficulties. All this is best effort! The cap. tables are subject to mistakes and comparisons are tough to make. For example:
– Founders do not always share equally the initial stake.
– There is no real definition of founders but the group of people who recognize themselves as such.
– ESOP reserved for future grants is a quite artificial part of the overall picture.
– When age was not available, a indirect measure was to consider a BS is obtained at age 22.
– Directors include independant directors only, not the investors.
– Finally not all companies went public, some were acquired and some filed but did not go public (yet)
Is there anything worth noticing? Well Biotech/Medtech founders are the oldest whereas SW and Internet entrepreneurs are the youngest. Surprising? Not really, but remember, these are not statistically valid data, this is just a compilation…


